Monthly Archives: May 2015

A ‘Simple Pattern’ for Trading

See Jay’s latest post: One More Plunge for Crude Oil?

As I admitted in my last post, I am a something of a trading “systemaholic”.

And yes, on many occasions I have started out with a simple idea and by the time I was done I had 600 lines of code and only  a vague recollection of what that original simple idea was.  So take it from me: While “complex” can be good, in the end the complexity of a trading method typically says very little about the ultimate usefulness of said trading method.

And yes, “simple” can definitely be beautiful.  So let’s look at a simple pattern.

Jay’s “Simple Pattern” Defined

To generate a buy signal this method looks for a particular 3-day pattern while the security in question is above its 200-day moving average.

*Filter: Security is trading above its 200-day moving average

*Day 1: Security closes below the low of the previous day

*Day 2: The day after Day 1 has no trading significance

*Day 3: Buy if the high of Day 3 is greater than the high of Day 2 (if no buy occurs on Day 3 the pattern is voided)

*The default is to buy at the Day 2 high plus ??? ($0.02?).  This would involve placing a stop order prior to the trading of Day 3.  But traders are encouraged to experiment with other entry methods.

*Set a stop-loss (open to discussion as to how far away to place stop)

*If not stopped out, then Exit on the first profitable close

That’s it.

This can also be utilized using weekly data, just use a 30-period (week) moving average as a trend filter rather than a 200 period moving average.

Example #1

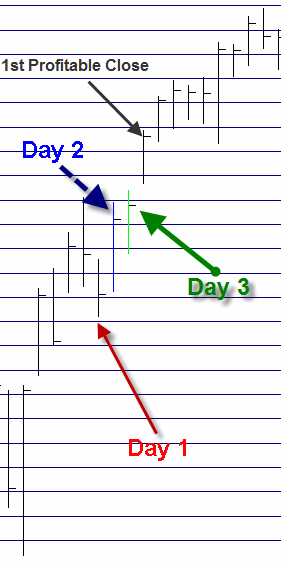
simple pattern example 1

Day 1 – the close is below the previous day’s low

Day 2 – the day after Trading Day 1

Day 3 – price breaks above Day 2 high triggering a long trade

1st profitable close occurs on day after Day 3

Example #2

Simple pattern example 2


Day 1 (1st red arrow) – the close is below the previous day’s low

Day 2 (1st blue arrow) – the day after Trading Day 1

Day 3 (not marked) – price DOES NOT exceed Day 2 high, so signal is voided

Day 1 (2nd red arrow) – the close is below the previous day’s low

Day 2 (2nd blue arrow) – the day after Trading Day 1

Day 3 (green arrow) – price DOES exceed Day 2 high, trade is entered above Day 2 high

1st profitable close – Price closes above entry price on Day 3 so trade closed there

Hopefully these examples help.

Jay’s “Simple Pattern” in Action

For the sake of example, let’s look at a daily bar chart for ticker IYR. In Figure 1 you see the daily chart with arrows drawn on all trading days that closed below the previous day’s low.  these days represent Day 1 in the pattern above.iyr daily 1Figure 1 – Ticker IYR with closes below previous low marked (this constitutes Day 1)  (Courtesy: AIQ TradingExpert)

Not every Day 1 signal generates an entry signal.  If the 2nd trading day after the “close below previous low” (Day 3) does not trade above the high of the day after the “close below previous low” day (Day 2), then no further entry signal exists and the pattern is voided.

Figure 2 displays ticker IYT with Day 3 highlighted only when an entry signal occurs.
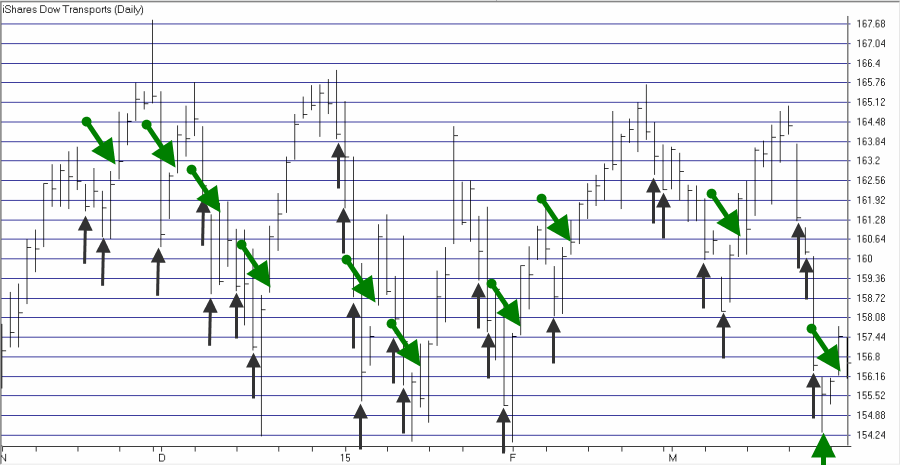
iyr daily 2Figure 2 – Jay’s “Simple Pattern” Day 3 entry Signals for Ticker IYT  (Courtesy: AIQ TradingExpert)

Figure 3 displays IYT “Simple Pattern” buy signals using a weekly bar chart.
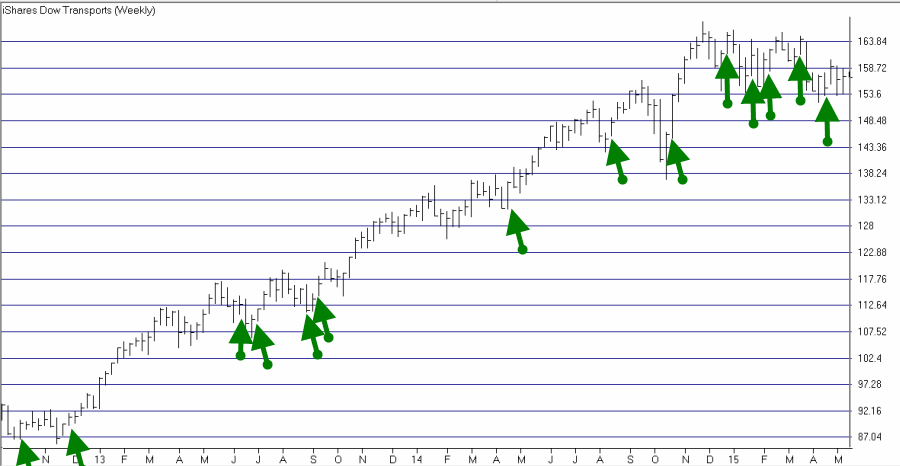
iyr weeklyFigure 3 – Jay’s “Simple Pattern” Day 3 entry Signals for Ticker IYT using Weekly Chart (Courtesy: AIQ TradingExpert)

The Difference Between a Trading “System” and a Trading “Method”

In my (troubled) mind:

*A trading “system” invokes a specific  set rules that tell the trader exactly when to buy and sell.

*A trading “method” is merely a set of criteria that helps to identify trading opportunities and typically comprises part of a trading system.

I consider this “Simple Pattern” to be more of a “Method” than a “System”.  Still for arguments sake, if I:

*Use it systematically using daily eMini S&P 500 data

*Subtract 0.25 S&P points for slippage & commission per contract buying and selling

*Use a stop-loss of 40.00 S&P points (a very wide stop FYI)

*Buy a 3-lot on each signal

*Exit on the first profitable close (if not stopped out)

I get the following hypothetical results starting in January 2007:

*Cumulative Gain= $67,163

*Maximum Drawdown = $11,400

*# Winning trades = 123 (88%)

*# Losing trades = 17 (12%)

*Average $ win = $1,203

*Average $ loss = (-$4,754)

The hypothetical growth of equity appears in Figure 4.4Figure 4 – Hypothetical results trading 3-lot of eMini S&P using Jay’s “Simple Pattern”; 2007-Present  (Courtesy: AIQ TradingExpert)
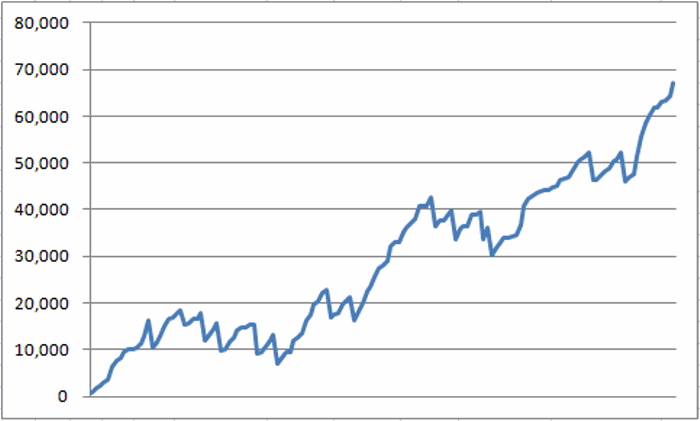
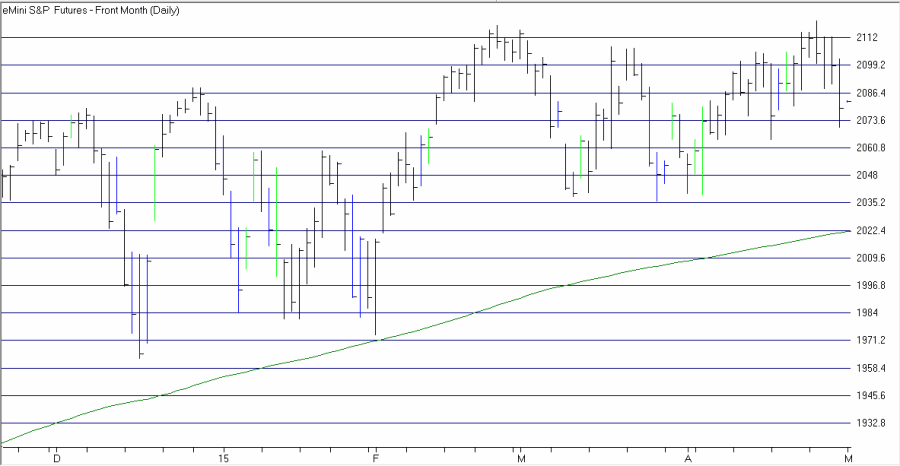
Figure 5 displays a “continuous” eMini S&P chart (front trading months strung together).  “Day 2″‘s are highlighted in blue, “Day 3″‘s that resulted in a buy signal are highlighted in green.5Figure 5 – EMini S&P futures with Days 2 in blue; Day 3 buy signals in green (Courtesy: AIQ TradingExpert)
Summary

So does this “Simple Pattern” constitute a viable standalone trading “system?”  I leave you to figure that out on your own.  But in any event the real point of this piece is simply to highlight the fact that when it comes to choosing a method or methods for trading in the financial markets, keep in mind:

Jay’s Trading Maxim #17: When it comes to the method you use to trade, remember, “It doesn’t have to be rocket science.”

Jay Kaeppel
One of My Favorite Websites for Trading Systems and Ideas

See Jay’s latest post “A Simple Pattern for Trading”

A while back I got over my addiction to Elliott Wave analysis. I finally realized I needed help and joined a five wave, er, step program. But some obsessions still linger. As an admitted “systemaholic” (“Hi, my name is Jay”) I am always on the lookout for new ways to make money without thinking. That’s actually not quite a fair statement. With a trading system you do your best thinking “up front” and then build it into a set of rules that can be repeated over and over. The basic idea is to remove the threat of experiencing that “OH MY GOD I AM LOSING MONEY I NEED TO DO SOMETHING REACTIONARY RIGHT THIS VERY SECOND THERE THANK GOODNESS I PANICED JUST IN THE NICK OF TIME OH WAIT CRAP THE MARKET JUST TURNED BACK IN MY FAVOR” moment.

I am guessing that most of you know what I am talking about.

One of my favorite websites for exploring new trading ideas – and in most cases, not just “ideas” but well researched and fleshed out systems is www.Quantocracy.com. In their own words Quantocracy is “a curated mashup of quantitative trading links”, which basically means they cull the best quantitative trading ideas they can find from a variety of websites and blogs and report back to you the reader.

One word of “warning”: when you click on a link from Quantocracy you’d better have your “thinkin’ cap” on, because most of the articles linked involve some serious analysis of some aspect of the financial markets.

Just remember, that’s a good thing.

Jay Kaeppel

Great Thoughts for Traders to Ponder

The words below come from an email I received last week.  The email was a weekly missive from Gregory H. Adams, a colleague of mine in the American Association of Professional Technical Analysts (AAPTA) and the Chief Investment Strategist at Allen, Mooney & Barnes Investment Advisors, LLC.  He left the source of the words below a mystery, but there is a great deal of wisdom contained.  As always, traders should not accept someone else’s experience and perception override their own thinking.

But good words of wisdom are always useful.  Thanks Greg for passing this on.

From Greg Adams email:

WOULD YOU BE INCLINED TO FOLLOW THE INVESTMENT ADVICE BELOW, WHICH WAS QUOTED ON AN OBSCURE WEBSITE THIS PAST WEEK? WHO SAID IT? TUNE IN NEXT WEEK FOR THE ANSWER.

1. Markets have consistently experienced “100-year events” every five years. While I spend a significant amount of my time on analytics and collecting fundamental information, at the end of the day, I am a slave to the tape (and proud of it).

2. Younger generation are hampered by the need to understand (and rationalize) why something should go up or down. By the time that it becomes self-evident, the move is over.

3. When I got into the business, there was so little information on fundamentals, and what little information one could get was largely imperfect. We learned just to go with the chart. (Why work when Mr. Market can do it for you?)

4. There are many more deep intellectuals in the business today. That, plus the explosion of information on the Internet, creates an illusion that there is an explanation for everything. Hence, the thinking goes, your primary task is to find that explanation. As a result of this poor approach, technical analysis is at the bottom of the study list for many of the younger generation, particularly since the skill often requires them to close their eyes and trust price action. The pain of gain is just too overwhelming to bear.

5. There is no training — classroom or otherwise — that can prepare for trading the last third of a move, whether it’s the end of a bull market or the end of a bear market. There’s typically no logic to it; irrationality reigns supreme, and no class can teach what to do during that brief, volatile reign. The only way to learn how to trade during that last, exquisite third of a move is to do it, or, more precisely, live it.

6. Fundamentals might be good for the first third or first 50 or 60 percent of a move, but the last third of a great bull market is typically a blow-off, whereas the mania runs wild and prices go parabolic.

7. That cotton trade was almost the deal breaker for me. It was at that point that I said, ‘Mr. Stupid, why risk everything on one trade? Why not make your life a pursuit of happiness rather than pain?’

8. If I have positions going against me, I get right out; if they are going for me, I keep them… Risk control is the most important thing in trading. If you have a losing position that is making you uncomfortable, the solution is very simple: Get out, because you can always get back in.

9. Losers average down losers

10. The concept of paying one-hundred-and-something times earnings for any company for me is just anathema. Having said that, at the end of the day, your job is to buy what goes up and to sell what goes down so really who gives a damn about PE’s?

11. The normal progression of most traders that I’ve seen is that the older they get something happens. Sometimes they get more successful and therefore they take less risk. That’s something that as a company we literally sit and work with. That’s certainly something that I’ve had to come to grips with in particular over the past 12 to 18 months. You have to actively manage against your natural tendency to become more conservative. You do that because all of a sudden you become successful and don’t want to lose what you have and/or in my case you get married and have children and naturally, consciously or subconsciously, you become more conservative.

12. I look for opportunities with tremendously skewed reward-risk opportunities. Don’t ever let them get into your pocket – that means there’s no reason to leverage substantially. There’s no reason to take substantial amounts of financial risk ever, because you should always be able to find something where you can skew the reward risk relationship so greatly in your favor that you can take a variety of small investments with great reward risk opportunities that should give you minimum draw down pain and maximum upside opportunities.

13. I believe the very best money is made at the market turns. Everyone says you get killed trying to pick tops and bottoms and you make all your money by playing the trend in the middle. Well for twelve years I have been missing the meat in the middle but I have made a lot of money at tops and bottoms.

(Word above not from) Jay Kaeppel

The Best VIX Strategy I’ve Found….But Still Don’t Quite Believe

Sorry folks, I had to pull this one at least for now.  It was pointed out to me that there was a flaw in the calculations I was using…..which would explain why it “looked too good”.

I am going back to the drawing board to re-examine if there is still some way to make the original idea useful.

Thanks to Mike and www.Quantocracy.com for alerting me to the potential “error in m ways.”

Jay Kaeppel

One of My Favorite Sites

In case you couldn’t tell, I love looking for (and especially finding) market “quirks” – trends and tendencies and correlations etc. that lie “off the beaten path” so to speak.  There are a few sites I like alot in terms of alerting me to things that I am pretty sure I would not have figured out on my own.  One of these is:

The McClellan Financial Publications Weekly “Chart in Focus”

Check it out.  There is no cost.  You can also download some free past copies of their excellent paid publications by going here and scrolling down and clicking under “Sample Report Issues.”

Lots of good reading and unique indicators and perspectives.

Jay Kaeppel


An Option Strategy to Put the Odds on Your Side

OK this one is targeted primarily to option traders, but can also be useful to traders who might consider trading options or to traders who are looking for a potential way to improve their investment odds.

So let’s consider

A) A potentally  bullish scenario

B) The standard way to play it

C) An alternative way to play it

In Figure 1 we see ticker CSCO as of 3/17/15:

A) In an uptrend (above its 200-day moving average)

B) Bouncing off of an oversold reading (my RSI Everything indicator fell to -32 then reversed)1Figure 1 – A potentially bullish setup for ticker CSCO on 3/17 (Courtesy: AIQ TradingExpert)

So for argument’s sake let’s refer to this as a “bullish scenario.”  In other words, we will hope that the uptrend will reassert itself and look for a way to make money if it does, while simultaneously limiting our risk by using an options strategy.

The “standard” approach would be to buy call options which stand to gain if the price of the stock goes up.  For our example trade we will buy 15 CSCO May 2 call options at $0.60 per contract.  The particulars appear in Figure 2 and the risk curves for this position appear in Figure 3.2Figure 2 – CSCO Long May Call Details (Courtesty OptionsAnalysis.com)

3Figure 3 – CSCO Long May Call Risk Curves (Courtesty OptionsAnalysis.com)

*The cost and maximum risk is $900

*With the stock trading at $28.15, the breakeven price is $29.60

*There are 59 calendar days left until option expiration

An Alternative Approach: The Directional Calendar Spread

Now let’s consider an alternative.  This strategy is typically referred to as a “Directional Calendar Spread”.  Here’s how I arrived at this trade:

At www.OptionsAnalysis.com I went to “Options/Skewfinder” and created and save a “Wizard” (a group of settings that can be reused in the future) with the settings that appear in Figure 4.4Figure 4 – SkewFinder inputs for www.OptionsAnalysis.com

From the output screen I took the top ranked trade which involves buying the July 29 call and selling the May 29 call EXCEPT:

*Instead of trading this position in a 1 x 1 ratio

*We will trade it in a ratio of 3 x 2 (this creates a position that has limited risk on the downside and unlimited profit potential on the upside – See Figure 6)

To compare apples to apples we will buy 18 July 29 calls and sell 12 May 29 calls so that the trade costs exactly the same as the long call trade – $900.

The particulars and the risk curves for this trade appear in Figure 5 and 6.5Figure 5 – CSCO directional calendar spread details (Courtesty OptionsAnalysis.com)6 Figure 6 – CSCO directional calendar spread risk curves (Courtesty OptionsAnalysis.com)

There are many similarities and differences between these two trades but there are 4 key things to focus on:

1) The long call position does enjoy greater maximum profit potential as it has a higher “delta” (556 versus 279 for the calendar spread.  This means that for each dollar the stock rises in price the first trade will gain $556 and the second $279).  So if a trader is flat out bullish and desiring to maximize his or her gains this trade will clearly make more money if that outlook proves to be correct.

2) The directional calendar spread stands to benefit from time decay – i.e., the fact that option time premiums decline to zero by expiration – while the long call stand as to be hurt by time decay.  We can tell this by the fact that the long call has a “Theta” value of -$11.12 (meaning it will lose $11.12 of time value each day) while the directional calendar spread has a positive “Theta” value of +$0.28).

3) At May expiration the long call position will cease to exist as the May 29 call will expire.  At May expiration the calendar spread will still hold 9 long July calls, which opens up other profit opportunities (for example, selling June calls and creating another spread position).

4) The directional calendar position has a breakeven price at the time of May option expiration of (approximately) $27.95 (I say “approximately” because a rise in implied volatility for the July call prior to May expiration could result in a higher breakeven price and vice versa).  The long call position has a breakeven price of $29.60, almost $2 higher than the calendar spread.

In other words, if CSCO stock is below $29.60 prior to May expiration the position will show a loss (assuming of course that is held until expiration) the directional calendar spread could conceivably be showing a profit if CSCO is under at $27.95 a share at May expiration.

The trade off to consider is this:

1) The long call position has the greater profit potential.

2) The directional calendar spread has the greater probability of generating a profit.

Now let’s fast forward to the close on 5/4/15.  The price of the stock has risen from $28.15 to $29.17.  At this point, one can argue that the Long May call position was the better trade.  The stock rose 3.6% in price which caused the option to rise 41.7%.  A trader could sell this position right now and reap his or her reward.  And taking a profit might just be an excellent idea at this point for the following reason:

*With 11 days left until expiration the stock is currently trading below the breakeven price of $29.60.  So if his position is held another 11 days and the stock does not rise from the current price of $29.17 to $29.60 or above, then the current open profit of $375 will vanish and the trade end up showing a loss.7Figure 7 – CSCO Long May Call with 11 days left until expiration (and a lot hanging in the balance) (Courtesty OptionsAnalysis.com)

Now let’s look at the current status and future prospects for the directional calendar spread.  As of 5/4/15 this trade is also showing a profit but the only $186, or +20.7%. So again, it can be argued that the May long call has been the better trade.  But before declaring a winner let’s look at the future prospects for the directional calendar spread.

As you can see in Figure 8, time decay could help this directional calendar trade a lot as May expiration nears.  In fact, the holder of this position would be perfectly content to see CSCO remain relatively unchanged between now and May expiration as the position profit could soar. 8Figure 8 – CSCO directional calendar spread as of 5/4 (Courtesty OptionsAnalysis.com)

Also, remember that when May option expiration hits, the holder of this position can either ext the entire position by selling the July calls and either buying back the May calls or letting them expire worthless depending on whether the price of CSCO is above or below the $29 strike price.

Summary

OK, so hat’s a lot to “chew on”, especially if your knowledge of options is limited (in fact if your knowledge of options is limited, let me say “Thank You” for slugging it all the way out to the end.  So let’s approach this from two angles:

If you are an “options person” (and I think you know who you are):

Whether or not you ever employ the Directional Calender Spread strategy is not the primary point.  The primary point is to always remember that there is usually more than one way to play any give situation.  In this example buying the call option would have worked out fine and you could cash out 11 days prior to expiration and taken a nice profit and avoid any concerns about giving it back due to time decay.

Still the directional calendar spread still has alot of upside potential in the days ahead as time decay may serve to “boost” profits if CSCO does anything other than fall sharply.  The holder of this position also has the opportunity to generate additional gains with the July call option portion of this trade.

If you are “new to options”:

Hopefully this piece opened your eyes to the possibilities available for traders who know how to do more than just buy shares of stock.  Or of course, your just confused as hell.  Here’s hoping it’s the former.

Jay Kaeppel

‘Sell in May’ Article #2,106

Yes it’s May and that is an exciting time for us financial writer types as we stumble over one another in our haste to post our obligatory “Sell in May and Go Away” related articles. As you can see, at #2,106 (for the record just sort of a ballpark guess – but probably pretty close to correct) I am a little late to the game (I knew I shouldn’t have gone away this weekend).

Anyway, given all the annual hubbub regarding selling in May and going away, it sort of makes me wish I had something really useful to offer. Anyway, let’s start by noting that in terms of the four-year presidential election cycle, 2015 is a “pre-election” year. This is significant because the pre-election year has by far been the best overall performer of the four years in the cycle (post-election, mid-term, pre-election and election years). Figure 1 displays the growth of $1,000 invested in the Dow only during pre-election years since 1933.1Figure 1 – Growth of $1,000 invested in Dow Industrials only during pre-election years

Regarding “Sell in May”, I start the annual “seasonally unfavorable” period after the close of the third trading day of May and extending through the close of the last trading day of October. The remainder of the year, i.e.,:

*From December 31st of the mid-term election year and the 3rd trading day of May and;

*from the close on October 31st of the pre-election year through the close of December 31st of the pre-election year.

…is considered the “seasonally favorable period”

Figure 2 displays the “seasonally favorable” and “seasonally unfavorably” periods broken out separately. 2Figure 2 – Growth of $1,000 invested in the Dow during seasonally “favorable” and “unfavorable” periods during pre-election years

From quick glance at Figure 2, a trader can clearly see that the “favorable” period has far outperformed the “unfavorable” period. So one might conclude that “selling in May” is a good idea during pre-election years. But in reality, that is not necessarily the case.

Close look at Figure 3 revels that there have been plenty of occasions when the Dow showed a gain during the so called “unfavorable” period within pre-election years.3Figure 3 – Growth of $1,000 invested in Dow Industrials only during “unfavorable” periods (i.e., May trading day 3 through end of October) during pre-election years

This is confirmed by the numbers that appear in Figure 4.

4

Figure 4 – Dow %+(-) during “unfavorable” periods within pre-election years

** – “Unfavorable period extends from end of 3rd trading day of May through the end of October

As you can see, the “unfavorable” period during pre-election years:

*Up 12 times
*Down 8 times
*Average UP = +8.0%
*Average DOWN = -5.4%
*Largest UP = +26.5% (1935)
*Largest DOWN = (-14.7) (1987)

Summary

So what does it all mean. I think it means three things:

A) Selling in May is not “automatic” this year

B) Keeping an eye on the trend is very important between now and the end of October is very important

C) You can probably skip the next 2,106 “Sell in May” articles you come across.

Jay Kaeppel

Bond Bummer


I have lamented on more than one occasion in the past that Murphy hates me. This sad fact has been reaffirmed in the last two months in the bond market.  During March I wrote this and this  highlighting the fact that the bond market has showed a long-term tendency to outperform during the last five trading days of the month.

So of course, what the heck happens during March and April?  In the immortal words of the Incredible Hulk, “It’s clobbering time!”

In Figure 1 you can see the wreckage that was the last five trading days of March and April.  A trader who “went for the gusto” and bought shares of triple leveraged ETF ticker TMF lost -16.9% during these 10 trading days.  Ouch.  Still, since TMF started trading this “strategy” is up +723% in 6 years.1Figure 1 – TMF tanks during last 5 days of both March and April

So am I embarrassed, ashamed, in doubt.  Not really.  The markets will do things like this to all of us from time to time.  The real key is to retain some perspective when things go terribly wrong.  To wit:

1) I did publish this article and noted that March and April had historically been the “weak sisters” in the “Last 5 days of the month” approach to bonds.  So it’s not like there was no warning.

2) When viewed from a long term perspective it can be argued that the action of the last two months as nothing more than a “bump in the road.”

Figure 2 displays the growth of $1,000 invested in ticker TMF only during the last five trading days of the month since TMF started trading in 2009.2Figure 2 – Growth of $1,000 invested in TMF only during last 5 days of month since April 2009

As you can see, the last two months were unquestionably “ugly.”  Still, they do not necessarily invalidate the long-term uptrend.

Just don’t tell Murphy I said that.

Jay Kaeppel