This should be called “The Conflict Edition.” Because there is a lot of conflict within the financial markets, and several trends that, a) are firmly in place and need to be respected, but, b) we should absolutely be looking for changes to in the future. I do want to point out this following important (well, at least according to me) point:
*Identifying the exact turning point in most of what follows is NOT the objective. Because when the change comes (again, at least in my opinion) the new trend will likely last for a long period of time.
Growth vs. Value
There is much love for growth stocks these days, and much disdain for value stocks. This WILL NOT last forever. If you doubt this (granted, opinion), please peruse Figure 1 and read the explanation below.
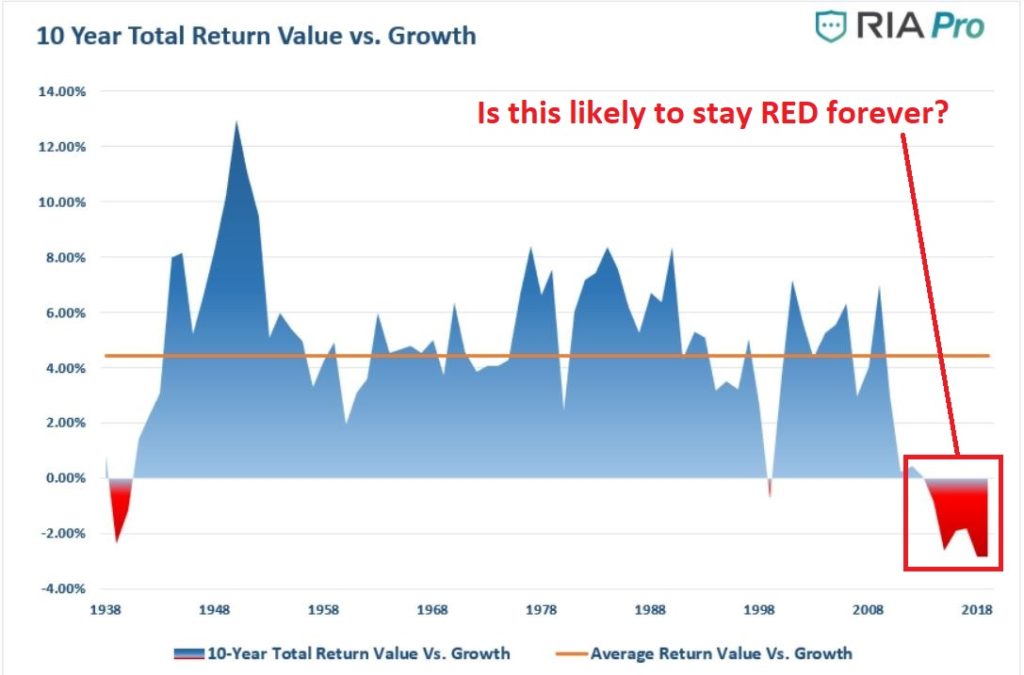
Figure 1 – 10-year Total Return for Value stocks minus 10-Year Total Return for Growth stocks (Source RIA Pro)
This chart takes the 10-year total return for growth stocks and subtracts that from the 10-year total return for value stocks.
*Positive values (in blue) indicate that value stocks outperformed growth stocks over the previous 10 years
*Negative values (in red) indicate the growth stocks outperformed value stocks over the previous 10 years
*Anyone making the argument that “Value is Dead” is essentially predicting that the line in Figure 1 will never turn blue again.
*Trying to catch the exact bottom in this relationship is not what matters. What matters is to recognize that that once this relationship does change, value stocks are likely to vastly outperform growth stocks.
For now, when that begins is anyone’s guess.
Gold vs. Silver
Silver is one of the “hottest” markets at the moment. And while it is overbought on a technical basis, there is no way I would fight the trend. That being said, Figure 2 is from Nautilus Research and the results suggest that gold will outperform silver over the next several years.
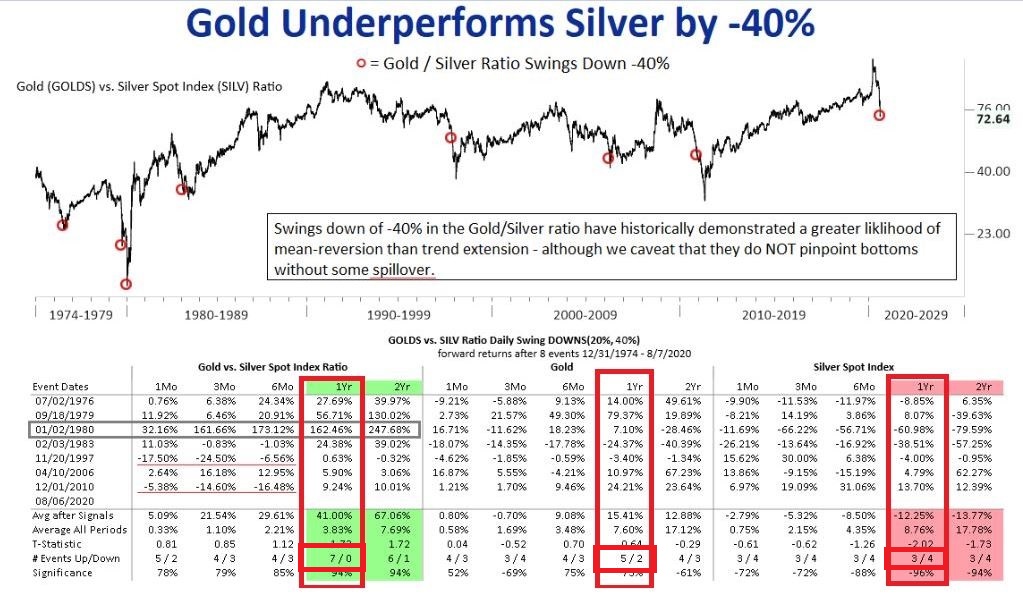
Figure 2 – Gold vs. Silver after the Gold/Silver Ratio drops 40% (Source; Nautilus Investment Research)
While a little tough to read, it basically shows that when the Gold/Silver ratio drops by 40% from a peak:
*Gold/Silver Ratio higher 1 year later 7 times and lower 1 year later 0 times
*Gold higher 1 year later 5 times and lower 1 year later 2 times
*Silver higher 1 year later 3 times and lower 1 year later 4 times
Commodities vs. Stocks
Commodities have been the dogs of the investment world essentially since they peaked in mid-2008. Figure 3 (from Bloomberg) displays a Commodity Stock Index performance relative to the Dow Jones Industrials going back to the 1930’s.
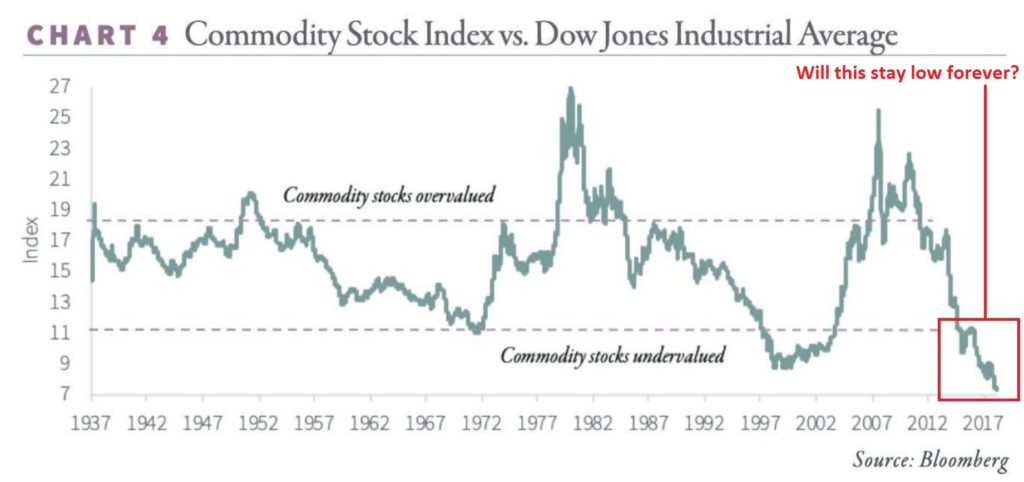
Figure 3 – Commodity Stock Index vs. Down Jones Industrial Average (Source: Bloomberg)
Note the following:
*By this measure commodities HAVE NEVER been cheaper relative to the broader stock market
*Commodities have been undervalued for several years already, which explains why it is fruitless to try to “pick the bottom”
*The current relationship WILL NOT last forever (in my opinion)
*When the change in trend finally does occur, it will likely represent a significant opportunity for those who are paying attention
Dumb Money versus Stocks
The excellent www.Sentimentrader.com website calculates a “Smart Money Index” and a “Dumb Money Index”. Figure 4 displays the current status of the Dumb Money Index (red dot at the far right), highlights previous peaks (red dots), and subsequent average performance (below the chart).
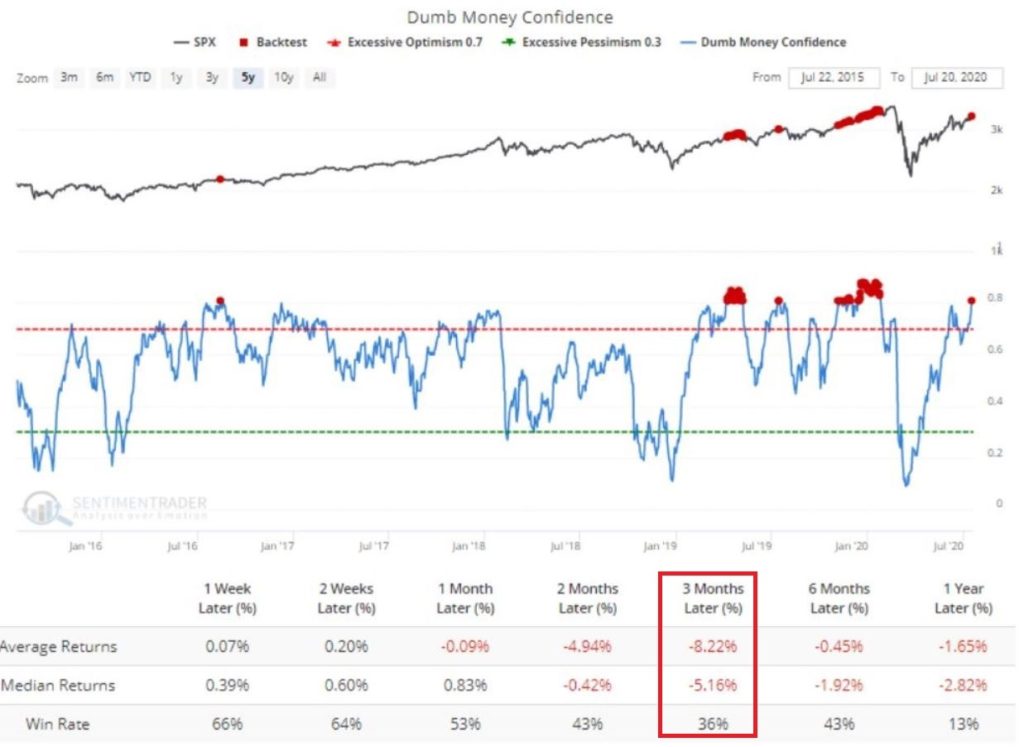
Figure 4 – Previous peaks in Sentimentrader.com Dumb Money Index (Courtesy Sentimentrader.com)
Bottom line:
*Stock market returns tended to be weaker than average going forward
*Average 3-month return -8.22%
Summary
None of the above necessarily amount to a “Call to Action.” But all constitute a “Call to Pay Attention.”
See also Jay Kaeppel Interview in July 2020 issue of Technical Analysis of Stocks and Commodities magazine
See also Jay’s “A Strategy You Probably Haven’t Considered” Video
See also Video – The Long-Term…Now More Important Than Ever
Jay Kaeppel
Disclaimer: The information, opinions and ideas expressed herein are for informational and educational purposes only and are based on research conducted and presented solely by the author. The information presented represents the views of the author only and does not constitute a complete description of any investment service. In addition, nothing presented herein should be construed as investment advice, as an advertisement or offering of investment advisory services, or as an offer to sell or a solicitation to buy any security. The data presented herein were obtained from various third-party sources. While the data is believed to be reliable, no representation is made as to, and no responsibility, warranty or liability is accepted for the accuracy or completeness of such information. International investments are subject to additional risks such as currency fluctuations, political instability and the potential for illiquid markets. Past performance is no guarantee of future results. There is risk of loss in all trading. Back tested performance does not represent actual performance and should not be interpreted as an indication of such performance. Also, back tested performance results have certain inherent limitations and differs from actual performance because it is achieved with the benefit of hindsight.


Always learn something from one your posts, Jay. They are much appreciated.
What is the “commodity stock index” that is used here?
Carl, in all candor I don’t know. I found the chart somewhere and there was no particular index listed. For what it’s worth it looks pretty similar to the perfromance of the Goldman Sachs Commodity Index. Jay