A lot of investors “bailed out” during the 2020 coronavirus market panic. Whether that will ultimately prove to be the right move or the wrong move only time will tell. But it is understandable. The one thing that never changes is human nature, and when a person is watching their net worth evaporate at a shocking pace human nature often intervenes shouting “STOP!”
Same as it ever was.
Since the bottom in late March the major indexes (if not necessarily the majority of stocks) have staged a strong rally. The question on most investor’s mind now is “When can we sound the “All Clear?” The truth is that there is no sure-fire, fool-proof method for doing so. But there are some things that can help.
The VIX/SPX “Everyone Back into the Pool” Signal
Every once in awhile the stock market gets clobbered. That is just a fact of life. When this occurs two things invariably happen
*The S&P 500 Index drops below its 200-day moving average
*The VIX Index soars
So how do we know when the worst is over? Well, one approach is to look for a reversal of the two things I just mentioned. So, we can look for:
*The VIX Index to drop back down below its own 200-day moving average
*The S&P 500 Index to rise back above its own 200-day moving average
First the bad news. This method will occasionally highlight a false breakout. In other words, VIX will fall below its MA, SPX will rise above its MA, and then – the S&P 500 Index goes south again (see Figures 2 and 5) .
NOTE: As a result, after a signal it is very important to keep a close eye on the S&P 500 Index to see if it continues to hold above its 200-day moving average or not. If it does not, you may need to “play defense” again.
The bottom line is that this is by no means an “automatic, you can’t lose” systematic strategy. Still, the “good news” is that more often than not this signal has proven to be a useful confirmation that it is safe to “get back in the pool.”
See the charts below.
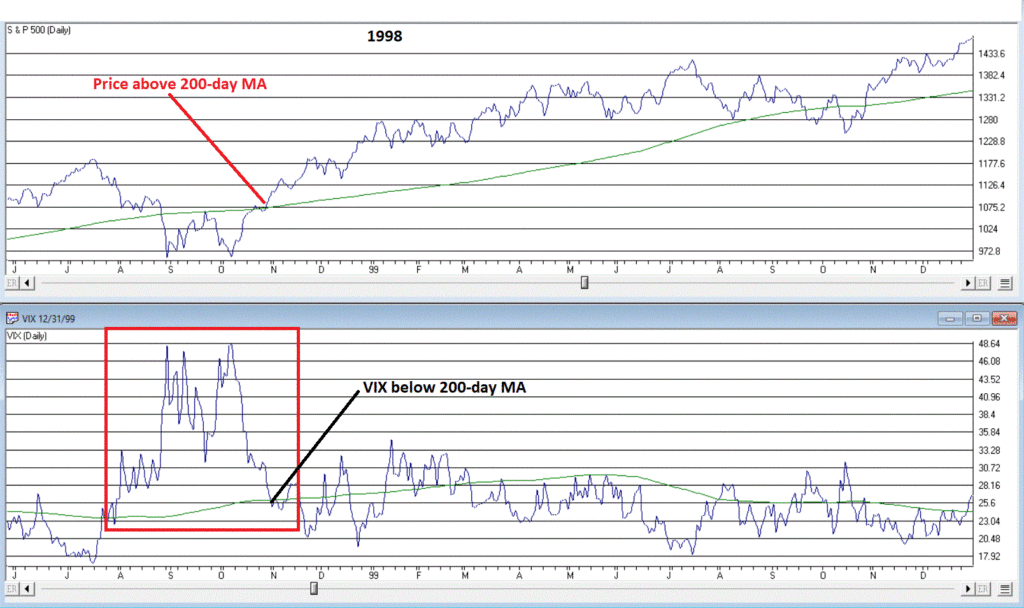
Figure 1 – 1998 (Courtesy AIQ TradingExpert)
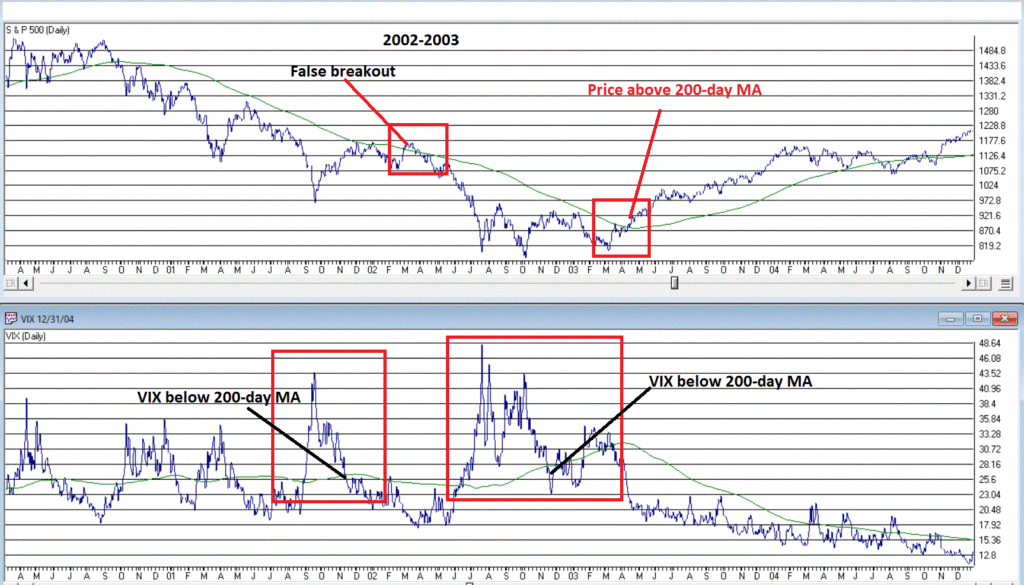
Figure 2 – 2002-2003 (Courtesy AIQ TradingExpert)
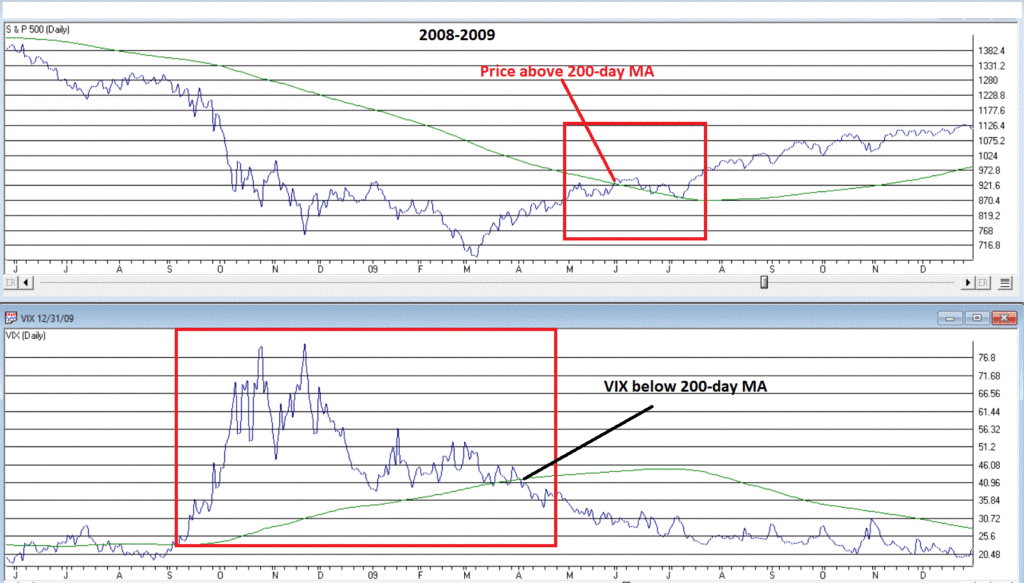
Figure 3 – 2009 (Courtesy AIQ TradingExpert)
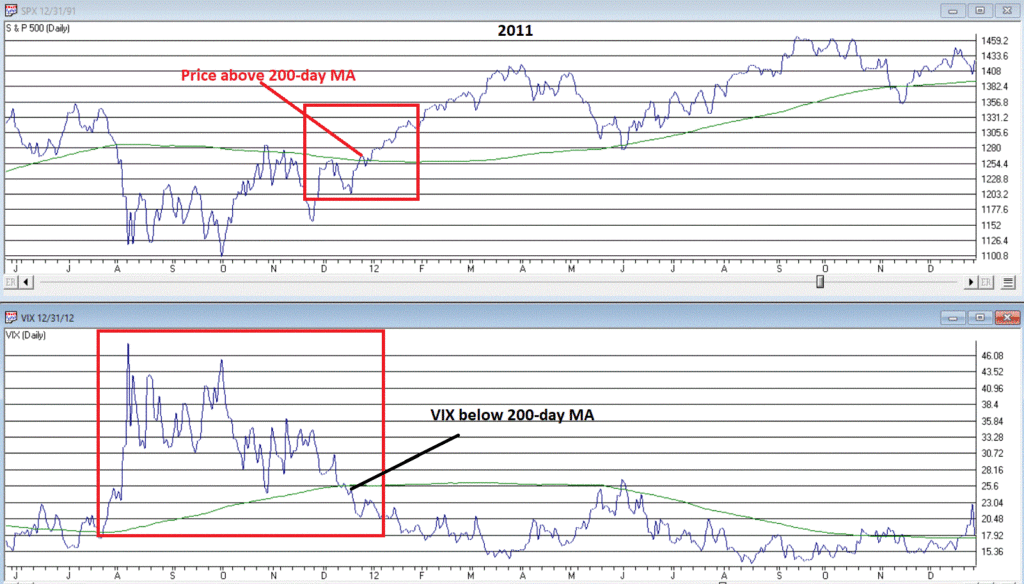
Figure 4 – 2011 (Courtesy AIQ TradingExpert)
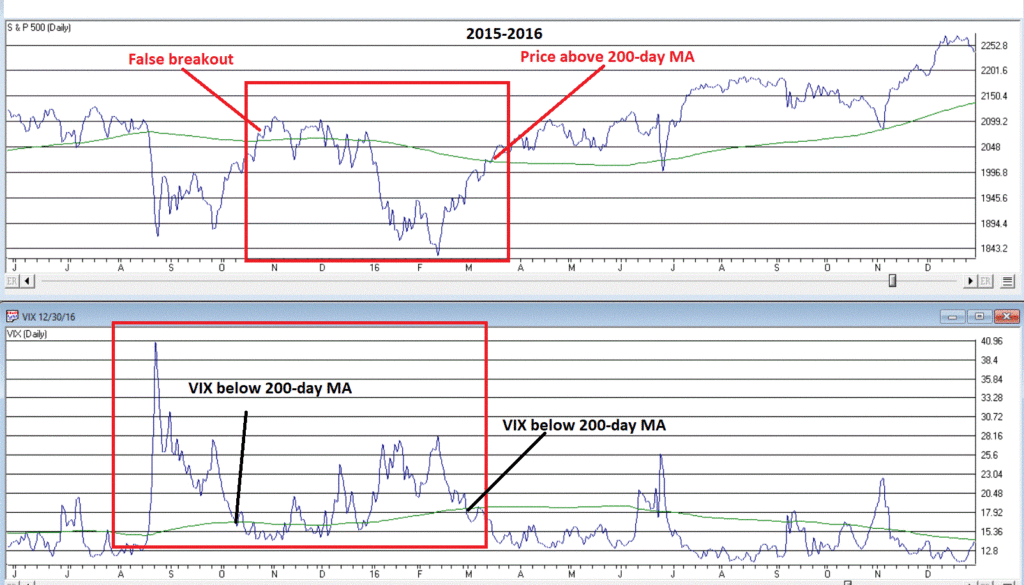
Figure 5 – 2015-2016 (Courtesy AIQ TradingExpert)
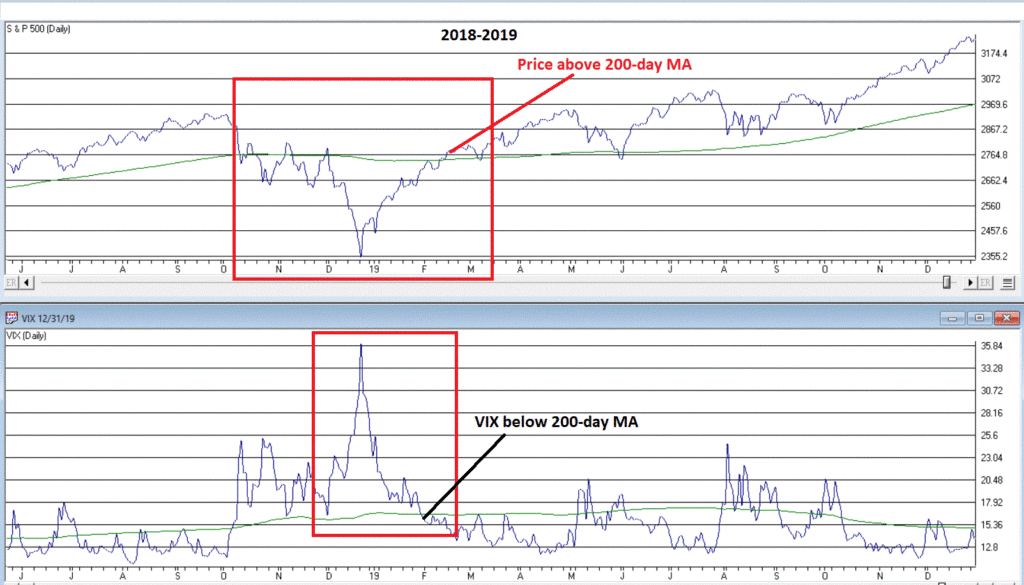
Figure 6 – 2018-2019 (Courtesy AIQ TradingExpert)
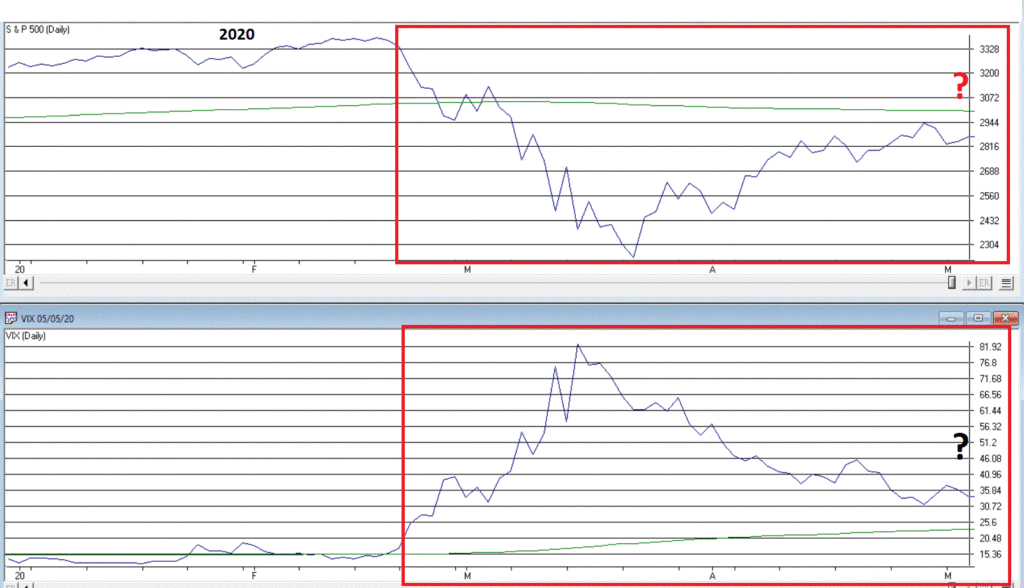
Figure 7 – 2020 (Courtesy AIQ TradingExpert)
Investors who want to track VIX and the S&P 500 Index can do so simply at www.StockCharts.com. Enter ticker $VIX and set the “simple moving average” to 200 then Update. then do the same for ticker $SPX.
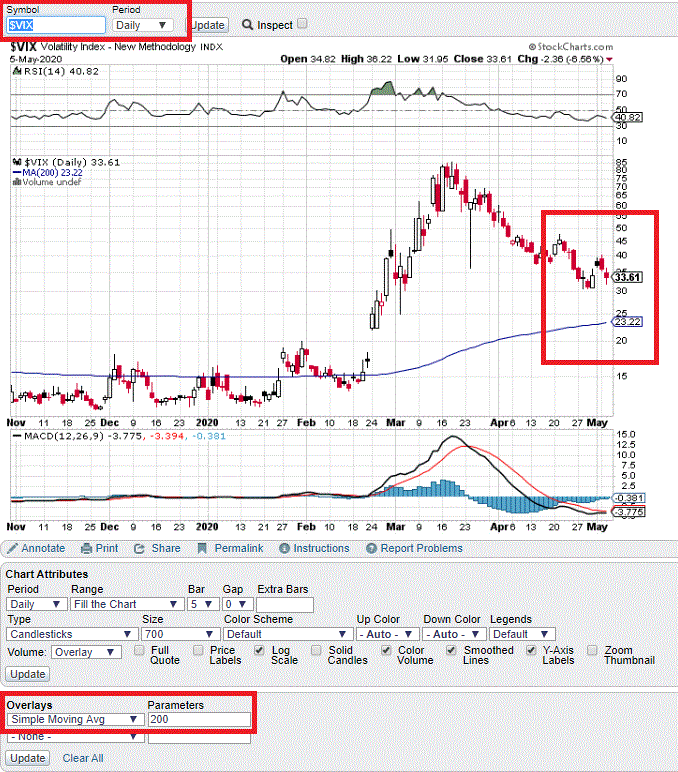
Figure 8 – Ticker $VIX at www.StockCharts.com
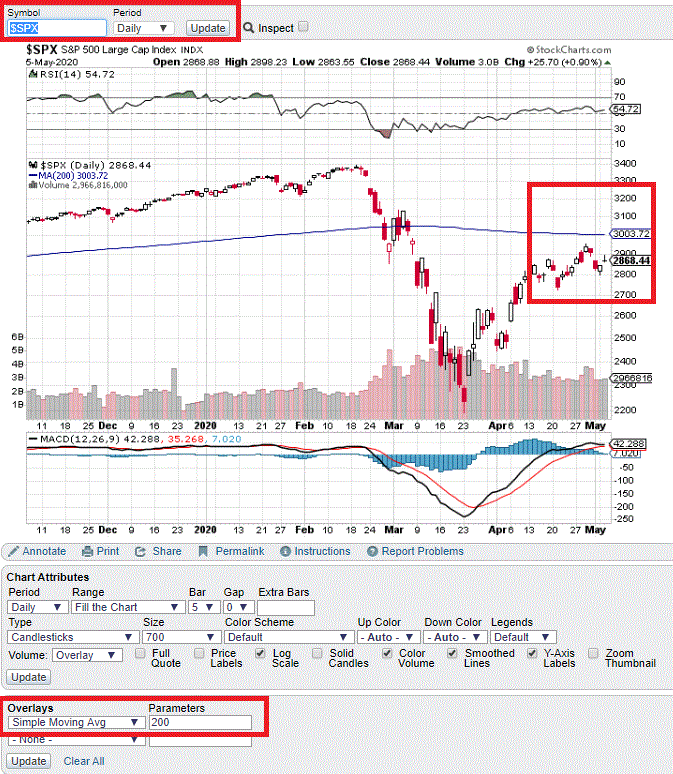
Figure 9 – Ticker $SPX at www.StockCharts.com
Summary
Technically speaking, one can argue that the stock market is in a “downtrend” as long as the S&P 500 Index is below its 200-day moving average – as it is now. So, a cautious approach to the stock market (i.e., something less than 100% full invested) is warranted.
At the moment, neither part of the “Everyone Back in the Pool” method has been triggered. So, investors should be keeping a close eye on the VIX Index and the S&P 500 Index for these simple clues that better days might be ahead.
Jay Kaeppel
Disclaimer: The information, opinions and ideas expressed herein are for informational and educational purposes only and are based on research conducted and presented solely by the author. The information presented represents the views of the author only and does not constitute a complete description of any investment service. In addition, nothing presented herein should be construed as investment advice, as an advertisement or offering of investment advisory services, or as an offer to sell or a solicitation to buy any security. The data presented herein were obtained from various third-party sources. While the data is believed to be reliable, no representation is made as to, and no responsibility, warranty or liability is accepted for the accuracy or completeness of such information. International investments are subject to additional risks such as currency fluctuations, political instability and the potential for illiquid markets. Past performance is no guarantee of future results. There is risk of loss in all trading. Back tested performance does not represent actual performance and should not be interpreted as an indication of such performance. Also, back tested performance results have certain inherent limitations and differs from actual performance because it is achieved with the benefit of hindsight.

