Some markets are prone to following seasonal trends and some markets are really prone to following seasonal trends. The soybean market falls into the latter category.
Why It Works
Soybeans are grown in other places around the world, however, the primary growing spot is the U.S. Midwest. Seeds are planted in the spring and harvested in the early fall. There is no real way around this schedule since farmers in the U.S. Midwest cannot go ahead and plant soybeans, a) early, since the ground is frozen until early spring, nor, b) late, since the seeds would die in the ground in the winter and even if they didn’t they wouldn’t grow nor could the farmer really get out and “harvest” anything due to the snow on the ground.
So, the planting, growing and harvesting schedule is pretty much set in stone in the Heartland.
This has certain implications. For one thing it means that between late fall and early spring there literally are NO soybeans growing. Likewise, bad weather (or exceptionally good weather) can impact how early the seeds can be planted and the likelihood of a good or bad crop year.
To put it another way – more related to supply and demand, which drives prices – between the time this year’s beans are harvested (fall) and the time that anyone can truly figure out how the next year’s crop will look (typically late spring to early summer), there is a lot of “doubt” about soybeans. This doubt tends to push prices higher as there are questions about potential future supply.
On the other hand, once it becomes pretty clear that this year’s crop is going to be, a) fantastic, b) awful, or c) somewhere in between, the doubts are eased and the “pressure” comes off of soybean prices.
That in a nutshell is everything you probably ever didn’t really want to know about soybeans. Certainly not as “exciting” as some new technology company or other revolutionary product. Still, as we will see, “predictability of supply and demand” can be a pretty exciting thing itself.
The Soybean 3-Step
As always let me first point out that what follows is for “Educational” purposes only and I am NOT encouraging anyone to start trading soybeans (either in the futures market by trading soybean futures or in the stock market by trading ETF ticker SOYB). I am just passing on some information that I found interesting and am hoping that you may as well (for the record, if you are still reading at this point after all the mundane gibberish about “the planting cycle” I think we’re doing pretty well).
Step 1 is BULLISH:
Long beans from close on the last trading day of January through the close on 2nd trading day of May (when there is doubt about this year’s planting, crop, etc.)
Step 2 is BEARISH:
Short beans from close on the 14th trading day of June through the close on 2nd trading day of October (after the state of this year’s crop becomes apparent)
Step 3 is BULLISH:
Long beans from the close on 2nd trading day of October through the close on 5th trading day of November (when there are new doubts about next year’s crop)
The Results
Figure 1 displays the hypothetical results (assumes no commission and no slippage) of holding a long position of 1 soybean futures contract during the 3 periods listed above (for soybean futures, each full $1 in price movement in the price of 5,000 bushels of soybeans is worth $5,000).
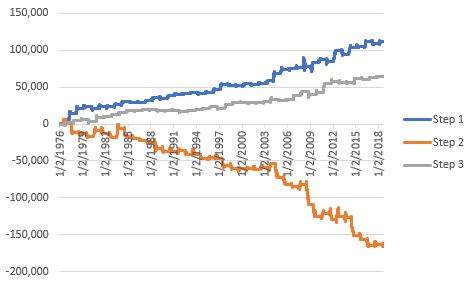
Figure 1 – $ gain or loss from holding long 1 soybean futures contract during Step 1 (blue); Step 3 (gray) and Step 2 (orange); 12/31/1975-9/7/2018
For the record:
*Step 1 (blue line) gained +$111,288
*Step 2 (orange) lost -$165,338
*Step 3 (grey) gained +$64,575
So, a strategy of:
*Holding a long position in soybeans during Step 1 and Step 3
*Holding a short position during Step 2
*Resulted in a (again, hypothetical) gain of $341,200 (See Figure 2)
*versus buying and holding a long position in soybean futures
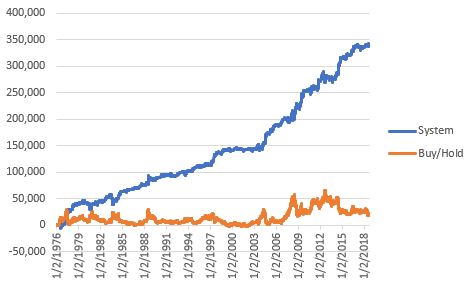
Figure 2 – Long beans Step 1 and Step 2, short beans Step 3 (blue) versus buying and holding long one soybeans contract (orange); 12/31/1975-9/7/2018)
Note in Figure 3 that the maximum drawdown exceeded -$18,000 on four separate occasions. So, DO NOT mistake this for some sort of “you can’t lose trading soybeans” contrivance. Trust me when I say that “the accumulation over time of slippage, commissions and $18,000 drawdowns will at some point test your will to go on.”
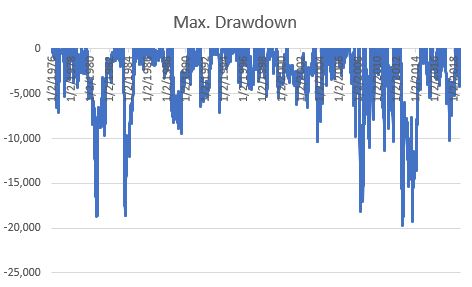
Figure 3 – Drawdowns using the Soybean 3 Step Method; 12/31/1975-9/7/2018
Still, the point is that all in all the results are fairly consistent.
Ticker SOYB
For those not inclined to wade into the exciting world of commodity futures there is a potential alternative – albeit one with less upside potential (i.e., lacking the leverage of commodity futures). Ticker SOYB is an ETF that tracks the price of soybean futures but trades like shares of stock in a stock account. SOYB started trading in September 2011. Figure 4 displays the growth of $1,000 invested in SOYB ONLY DURING step 1 and Step 3 each year since inception of trading versus buying and holding SOYB (it is possible to sell short shares of SOYB during Step 2 but that is not included in this test since – let’s be honest – very few traders are ever going to actually sell short shares of SOYB).
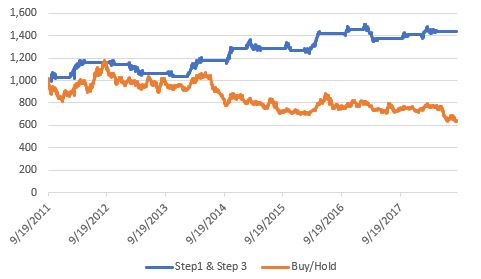
Figure 4 – Growth of $1,000 invested in SOYB during Step 1 and Step 3 (blue line) versus $1,000 invested in SOYB using buy-and-hold (orange); 9/19/2011-9/7/2018
For the record:
*$1,000 invested in SOYB only during Step 1 and Step 3 grew to $1,439 (+43.0%)
*$1,000 invested in SOYB using a buy-and-hold approach declined to $643 (-35.7%)
*The maximum drawdown so far holding SOYB during Step 1 and Step 3 has been -12.5%
Summary
Are soybeans for everyone? Certainly not.
But if you are going to consider trading them it might be wise to consult your calendar first.
Jay Kaeppel
Disclaimer: The data presented herein were obtained from various third-party sources. While I believe the data to be reliable, no representation is made as to, and no responsibility, warranty or liability is accepted for the accuracy or completeness of such information. The information, opinions and ideas expressed herein are for informational and educational purposes only and do not constitute and should not be construed as investment advice, an advertisement or offering of investment advisory services, or an offer to sell or a solicitation to buy any security.


Hi Jay
I understand that you are not advocating this as a strategy but the running P/L graph from 1976 is certainly giving credence to this strategy. It was also great to see the draw down curve for reference. It would seem reasonable if a large account (1.5m USD+) to have a small allocation of 5% to a source of alpha like this one, possibly incorporating futures options to further improve basis.
I am not sure whether you wish to disclose other metrics such as standard deviation or sharp ratio of this strategy but it would be a great bonus.
Many thanks for the great work again and appreciate you sharing your thoughts here.
Regards
Raymond