When it comes to “consumers consuming”, there are two primary categories:
*Consumer staples: i.e., the stuff we “have” to buy
*Consumer discretionary: The stuff we “want” to buy
The interesting thing is that even though we “always” have to buy the stuff we have to buy and even though we always want to buy the stuff we want to buy, the reality is that there is a time to invest in the companies that make the stuff we have to buy and a separate time to invest in the companies that make the stuff we want to buy (Note to myself: work on those run on sentences).
Two Funds
For our purposes we will use the two following funds to represent our two categories.
*FDFAX Fidelity Select Consumer Staples (“have to buy”)
*FSRPX Fidelity Select Retailing (“want to buy”)
The Test
*We will use monthly total return data from PEP Database from Callan Associates starting in January 1986 through June 2018.
For our purposes we will hold:
*FDFAX from May 1st through October 31st
*FSRPX from November 1st through April 30th
We will look at:
*The results using the “System”
*The results of buying and holding both funds with a rebalance every 6 months (at the end of April and the end of October)
*The results of doing the “opposite” of the System (i.e., hold FSRPX May through October and FDFAX November through April)
The Results
Figure 1 displays the growth of equity for all 3 methods.
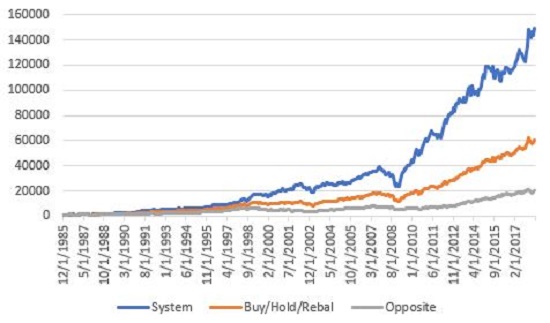
Figure 1 – Growth of $1,000 for “System”(blue), Buy/Hold/Rebalance (orange) and “Opposite” (grey); 12/31/1985-6/30/2018
For the record:
*$1,000 invested using our “System” grew to $148,951
*$1,000 invested using the “Buy/Hold/Rebalance” method grew to $60,475
*$1,000 invested using the “inverse” approach grew to $19,840
Other Items of Note
Let’s look at “yearly” results. For our purposes a year ends on October 31st (i.e., after each full 6 months FDFAX/6-month FSRPX investment cycle)
*# times System UP = 30
*# times System DOWN = 2
*# of times Buy/Hold/Rebalance UP = 28
*# times Buy/Hold /Rebalance DOWN = 4
*# times System outperformed Buy/Hold /Rebalance = 21
*# times System underperformed Buy/Hold /Rebalance =11
Average 12 month % + (-):
*System = + 17.7%
*Buy/Hold /Rebalance = +14.2%
Summary
So, is this switching idea a viable standalone investment method? Sorry folks, I just crunch the numbers. Before getting too carried away, a quick check with “Realville” reminds us that the “System” experienced a -40% decline from late-2007 through Feb 2009. So, no “low risk, you can’t lose” opportunity here.
Still, for simplicity’s sake and over consistent performance – as my friend from Jersey would say, “I’ve seen woise.”
Jay Kaeppel
Disclaimer: The data presented herein were obtained from various third-party sources. While I believe the data to be reliable, no representation is made as to, and no responsibility, warranty or liability is accepted for the accuracy or completeness of such information. The information, opinions and ideas expressed herein are for informational and educational purposes only and do not constitute and should not be construed as investment advice, an advertisement or offering of investment advisory services, or an offer to sell or a solicitation to buy any security.


Hold equal weight FDFAX and WHOSX May through October and you are golden.