See Part 1 here and Part 2 here; See also “One Last Fizz Enhancer for Coca-Cola”
An Actual (Theoretical) Approach to Trading KO
So let’s assume two traders took the following approaches to trading KO starting on 12/31/1981, each with $1,000:
*Trader A bought $1,000 worth of KO stock and held it through 6/2/2015.
*Trader B bought and held KO stock twice a year, during the two favorable periods I have identified in Part 1 and Part 2 (March Trading Day 10 through June Trading Day 2 and October Trading Day 12 and November Trading Day 19). We will further assume that Trader B used a margin account and bought KO stock using leverage of 2-to-1. Finally, we will also assume that he earns 1% annually when out of KO stock and in cash.
Results
Starting with $1,000 between 12/31/1981 and 7/14/1998:
*Trader A saw his original $1,000 investment soar a stunning 6,007%, to $61,069 as KO stock went from $0.72 to $43.97 a share (also known as “The Good Old Days”).
*Trader B who held KO twice a year using margin saw his original $1,000 grow +2,068% to $21,676. Not bad, but nowhere close to the buy-and-hold approach. Since that time however, the table have turned dramatically.
Starting with $1,000 between 7/14/1998 and 6/2/2015:
*Trader A saw his original $1,000 investment decline by 6.8% to $932.
*Trader B who held KO twice a year using margin saw his original $1,000 grow +3,540% to $36,406.
So if we combine the two periods, starting with $1,000 between 12/31/1981 and 6/2/2015:
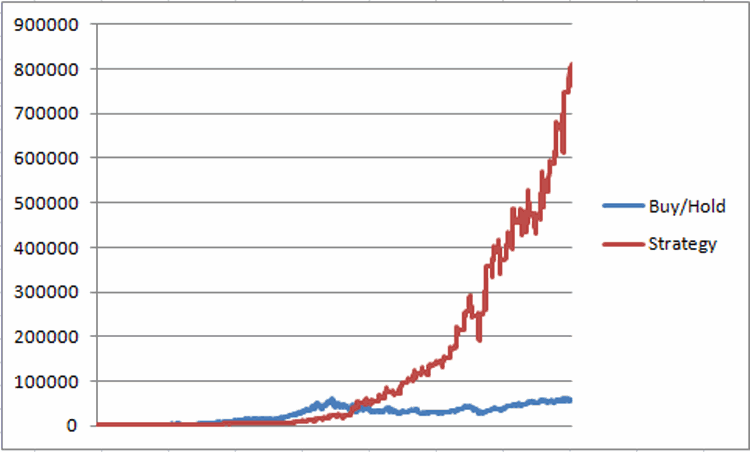
*Trader A saw his original $1,000 investment grow by +5,593% to $56,931.
*Trader B who held KO twice a year using margin saw his original $1,000 grow +78,814% to $789,140.
The net results for both traders appears in Figure 1. Figure 1 – Growth of $1,000 for Buy/Hold (blue) versus twice a year KO Seasonal Strategy; 12/31/1981-6/2/2015
For the record, these results do not deduct interest paid on margin debt, commissions or taxes. Still, even if we made some deductions for these items, there would still be a wide disparity between “System Results” and “Buy and Hold Results.”
Annual Year-by-Year Results appear in Figure 2
| Year | Strategy | Buy/Hold |
| 1982 | 11.1 | 50.0 |
| 1983 | 21.5 | 2.8 |
| 1984 | 3.9 | 17.1 |
| 1985 | 65.2 | 35.4 |
| 1986 | (6.0) | 34.1 |
| 1987 | (39.6) | 0.8 |
| 1988 | (7.8) | 17.2 |
| 1989 | 86.2 | 73.1 |
| 1990 | 93.5 | 20.3 |
| 1991 | 34.0 | 72.6 |
| 1992 | 17.5 | 4.4 |
| 1993 | (9.7) | 6.5 |
| 1994 | 5.1 | 15.5 |
| 1995 | 28.8 | 44.1 |
| 1996 | 44.5 | 41.8 |
| 1997 | 41.5 | 26.7 |
| 1998 | 34.5 | 0.5 |
| 1999 | 62.7 | (13.0) |
| 2000 | 48.4 | 4.6 |
| 2001 | 8.0 | (22.6) |
| 2002 | 20.8 | (7.0) |
| 2003 | 41.3 | 15.8 |
| 2004 | 18.5 | (18.0) |
| 2005 | 17.6 | (3.2) |
| 2006 | 19.6 | 19.7 |
| 2007 | 49.0 | 27.1 |
| 2008 | (2.7) | (26.2) |
| 2009 | 55.7 | 25.9 |
| 2010 | 10.1 | 15.4 |
| 2011 | 1.6 | 6.4 |
| 2012 | 8.1 | 3.6 |
| 2013 | 25.6 | 14.0 |
| 2014 | 27.0 | 2.2 |
| Average | 25.3 | 15.4 |
Figure 2 – Year-by-Year Results: Seasonal Strategy versus Buy-and-Hold
Summary
Buying on margin is in fact a “risky” strategy in that it exposes a trader to increased volatility of returns. As such it is certainly “not for everyone.” And of course, relying solely on seasonal trends is not something that the vast majority of traders are comfortable doing. Finally, there is clearly no guarantee that “strategy” I have outlined will continue to work in the future. So if you choose not engage in this particular strategy I will raise no objections.
But the purpose of these articles is not really to convince you to pursue this given strategy or that given strategy. The real purpose is:
a) To make you look at things differently than the average investor might
b) To help you learn to identify strategies that the vast majority of traders bypass
c) To point out that it is in fact possible to accumulate great wealth if you are willing to do the work necessary to:
- Identify a unique strategy
- Follow that strategy long enough to derive the expected benefit
Jay Kaeppel


One thought on “How to Put the Fizz Back in Coke (Part 3)”
Comments are closed.