Watching Weekly Dow Momentum
The stock market – like the Energizer Bunny – just keeps chugging along, with the Dow, the S&P 500 and the Nasdaq 100 all touching new highs in the last week (the Russell 2000 small-cap index is another story, and may ultimately serve as the “canary in the coal mine”, but for now “majority rules”). So for now, disciplined trend-followers (“Hi my name is Jay – although it is a little difficult to speak at the moment as my teeth remain tightly clenched”) have done well to avoid all of the “Sell in May” warnings from all of those so called experts (“Um, hi my name is Jay?”). But there is one sign that I think investors should follow that has historically proven useful during the middle months of mid-term election years.
I first wrote about this on 5/6/2014 in an article titled “A Warning Sign to Watch“. For full details I suggest you read that article, but for now let me give you the gist.
-Between May and October of mid-term election years, a warning sign occurs when the MACD Oscillator (many traders refer to it as the MACD Histogram) drops into negative territory.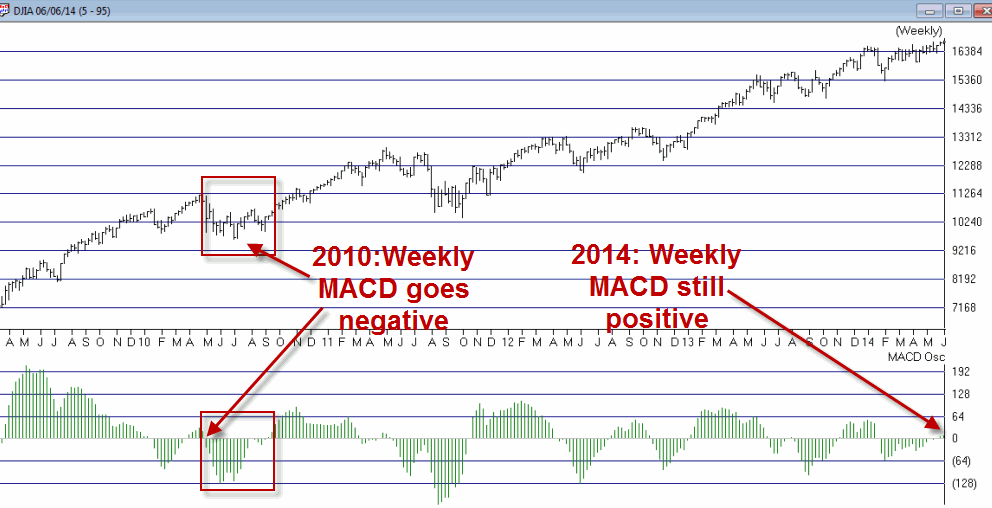 Figure 1 – Weekly Dow Industrials with MACD Oscillator (watch for drop to negative territory)
For the record, the MACD Oscillator was below 0 during early May, but was in a rising trend along with the Dow itself. The Oscillator returned to positive territory on 5/23 and remains there still. So let me sum up my advice as succinctly as possible:
*KEEP AN EYE ON THE WEEKLY MACD OSCILLATOR FOR THE DOW JONES INDUSTRIALS AVERAGE. If it drops into negative territory be prepared to take defensive action.
If you have even the most basic charting software, checking the status of the weekly Dow MACD Oscillator after the close each week will take up approximately 12 seconds of your time. Per the 5/6/14 article, if history is any guide, the 12 seconds a week time investment may prove to be very useful.
Looking for a Reversal in T-Bonds
As I write, t-bonds are in the middle of a nasty short-term sell off. But there is hope. As I wrote about on 4/8/14 in an article titled “A Simple Signal for Bond Traders”, a short-term bullish setup may be forming at the moment. In a nutshell:
*When the 25-day moving average for ticker EWJ is below the 150-day moving average for ticker EWJ (long story short, t-bonds tend to trade inveersely to Japanese stocks – go figure), then
*Wait for the 10-day CCI (Commodity Channel Index) for ticker TLT to drop below -100 and then turn up for one day.
Once that occurs a trader might consider buying the call option with at least 40 days left until expiration and the highest gamma among call options for that expiration.
In Figure 2 you can see that this setup is presently “locked and loaded” and will be triggered when the 10-day CCI for ticker TLT reverses back to the upside.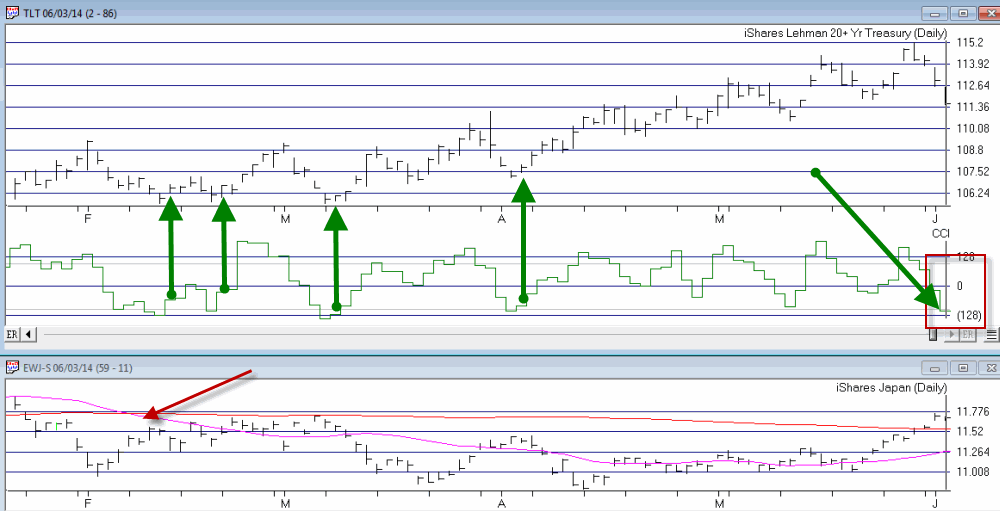 Figure 2 – TLT forming a potentially bullish setup
Traders should always remember that there is never any guarantee that the next signal will generate a profit, and should always have some sort of stop-loss or risk limiting planin place at the time that any new trade is entered.
Jay Kaeppel

