Last week (http://tinyurl.com/koen2lq) I wrote my (obligatory) “Sell in May” related article (I’m pretty sure there is a law that all market writers must write at least one “Sell in May” related article each year – how else to explain the glut).
To sum up, there could be great trouble in the stock market in the next several months- or not – depending. OK, granted that kernel of knowledge is not necessarily very helpful, but at least it is factually correct.
May to November in Mid-Term Years
Figure 1 displays the performance of the Dow between the close of the third trading day of May and the end of October during mid-term election years since 1962. 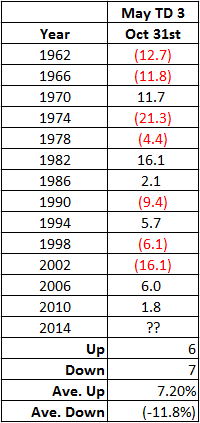
Figure 1 – Dow % +(-) from close of 3rd trading day of May through October 31st during mid-term election years
Interestingly, the net result of all of this is a loss of -37.6%. So at first blush one might assume that selling now is the proper course of action. But things are never cut and dried when it comes to the stock market (have I mentioned lately that I hate that part). As you can also see in Figure 1, 6 times the Dow showed a gain, 7 times a loss. So it is not like the market declines during this time period every four years. Not even close. It is just that when things do go wrong they tend to go really wrong.
Keep an Eye On the Weekly MACD for the Dow
So how do we know if 2014 is going to be one of the “things really gone wrong” years or not? Well, we can’t, but we can keep an eye on certain warning signs. One that might be useful is the MACD indicator applied to the weekly price data for the Dow Jones Industrials Average (using the standard 12/25/9 parameter values).
For our purposes we will use some relatively (OK, ridiculously) simple rules:
MACD Oscillator > 0 = GOOD
MACD Oscillator < 0 = BAD
A few caveats before we look at some previous results. First, this does NOT constitute a trading “system”, nor would I even call it a “market timing” tool. I would refer to it simply as a filter that can help to guide you in deciding how aggressive (or not) to be in the stock market in the months ahead.
The History
Figure 2 shows 1970. The MACD broke down prior to early May and the Dow broke hard in May before reversing back to the upside. In this case the MACD filter would have kept an investor out of some choppy market action. (FYI: The charts in Figures 2 through 14 are courtesy of AIQ TradingExpert). 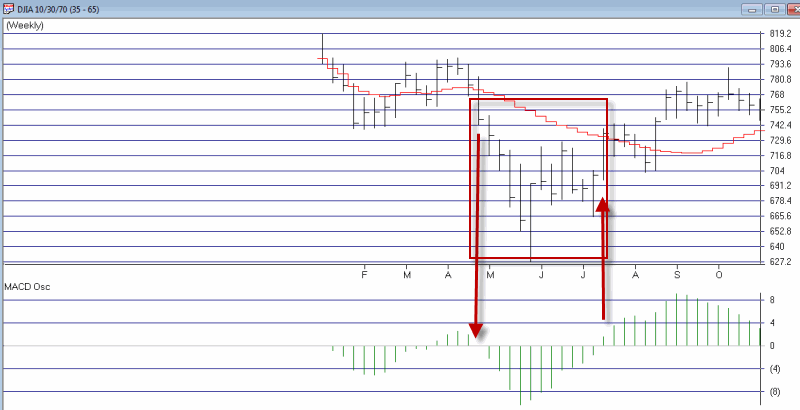 Figure 2 – 1970
Figure 3 shows 1974. The MACD broke down in early May and would have kept an investor out of the pummeling that followed in the months ahead.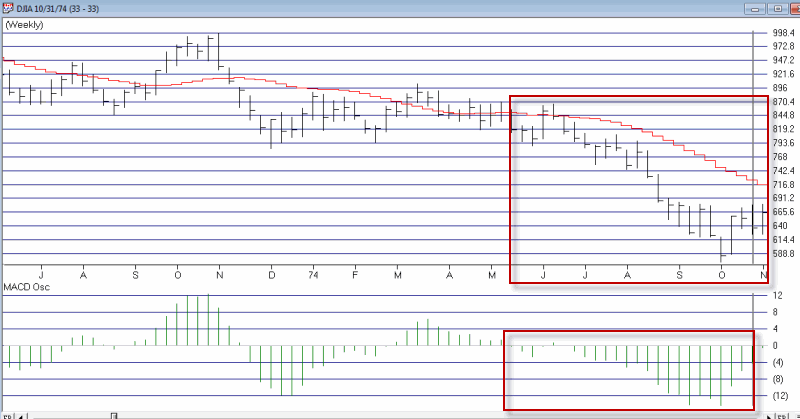 Figure 3 – 1974
Figure 4 shows 1978. The MACD and the market drifted higher until September when the MACD oscillator went negative. This would have gotten an investor out before the “mini crash” in the month of October. Figure 4 – 1978
Figure 5 shows 1982. The MACD breakdown in June would have kept an investor out of some choppy action for the next two months, but they would also have been on the sidelines during the first thrust up during August. The good news is that the MACD oscillator went positive after the first big up week in August 1982 so an investor would have gotten back in sooner than if he or she had waited until the end of October. Figure 5 – 1982
Figure 6 shows 1986. Something of a mixed bag. Technically the Dow moved higher (by +2.1%) between May and October, but the market was very volatile and choppy along the way, so some investors might have been more content to be on the sidelines earning interest.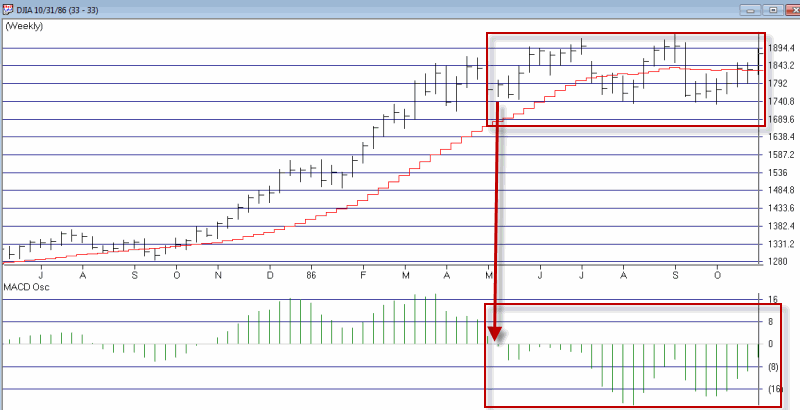 Figure 6 – 1986
Figure 7 shows 1990. Once the “bow broke” so to speak in the first week of August, the “cradle was rocked” as the Dow fell hard. Selling at the first sign of (MACD) trouble would have had an investor out during the sharp 3rd quarter 1990 break.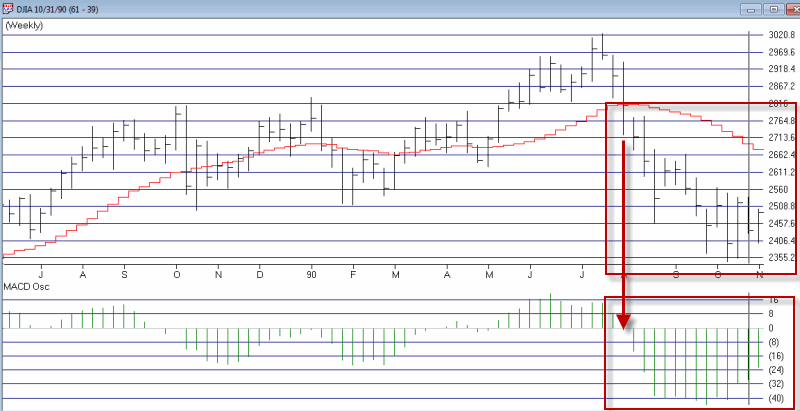 Figure 7 – 1990
Figure 8 shows 1994. Not the most useful signal this time around. The MACD oscillator was already negative by early May. The market chopped around for a few months before the MACD oscillator went positive during late July with the Dow about 100 points higher than its level of early May. Figure 8 – 1994
Figure 9 shows 1998. The MACD broke down prior to late May. The Dow rallied pretty sharply from June into July but then suffered a -22% decline into September. In this case the MACD filter would have kept an investor out during this period.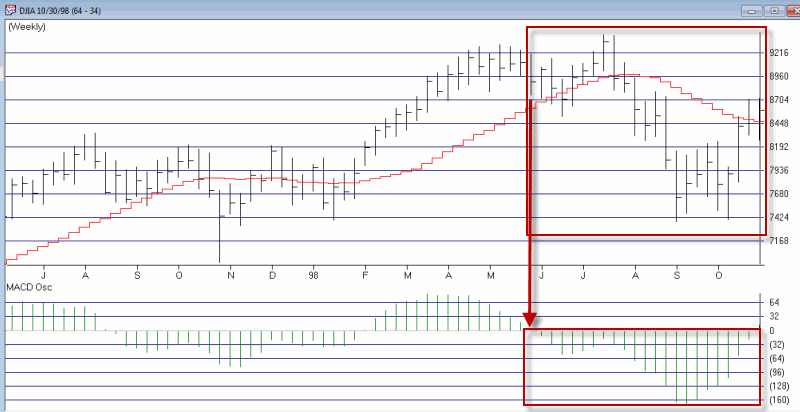 Figure 9 – 1998
Figure 10 shows 2002. Not much to say here. The MACD oscillator was already negative by early May and the market suffered a severe bear market break between May and October. In this case the MACD filter would have kept an investor out during this period.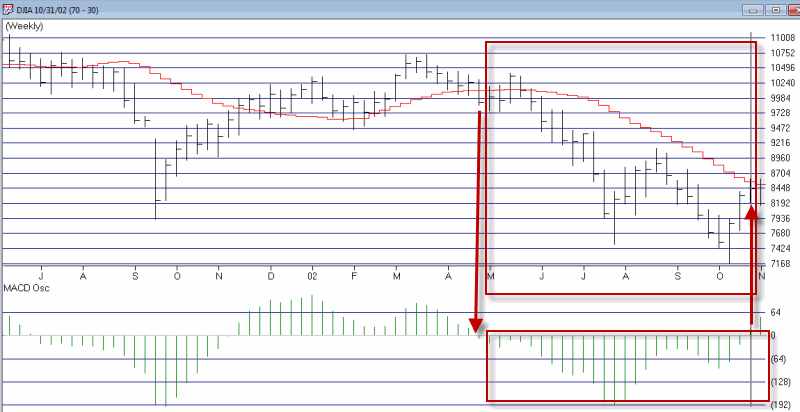 Figure 10 – 2002
Figure 11 shows 2006. This one is something of a mixed bag. The bearish MACD warning in late May would have allowed an investor to miss some pretty choppy action into mid-July but by the time the MACD went positive in August the Dow was 100 point above it level in May when the MACD flashed a warning.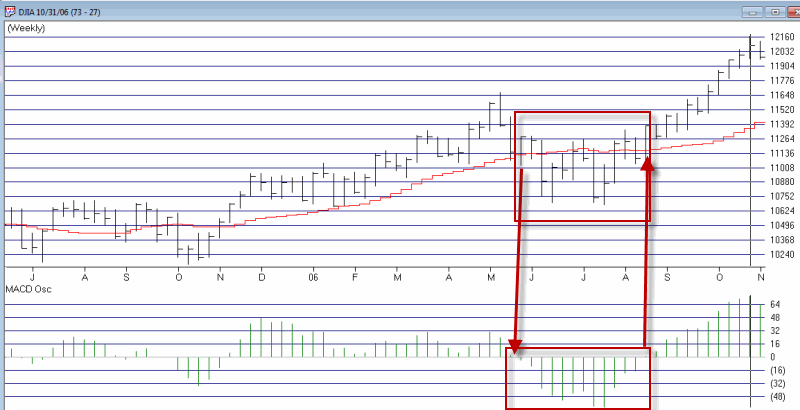 Figure 11 – 2006
Figure 12 shows 2010. Another “mixed bag”. The MACD broke down the first week in May and the Dow continued to decline in a fairly volatile manner into July. Still, by the time the MACD went positive again in September the Dow was about 80 points above its “May MACD warning signal” level.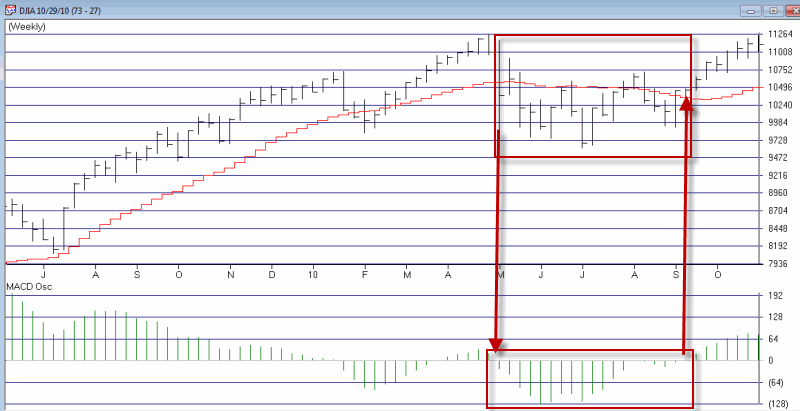 Figure 12 – 2010
So what about 2014? As you can see in Figure 13, the MACD broke down in January and was negative as of the close of the third trading day of May, so this is technically a “warning.” On the flip side, if the market does not break down in the next week or so the weekly MACD will likely flip back to the positive side. 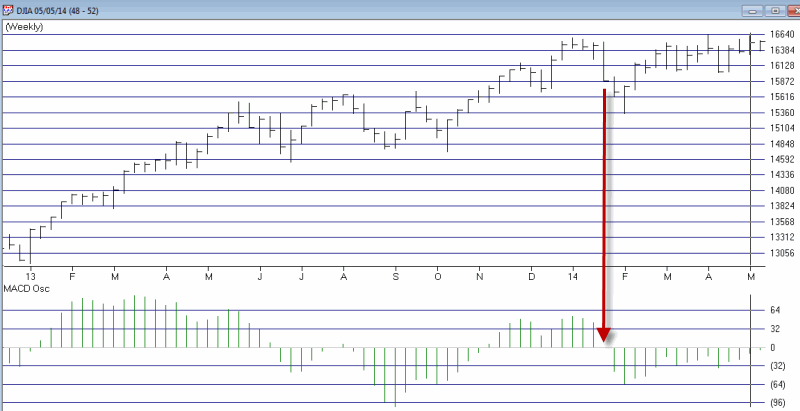 Figure 13 – 2014
Summary
As a trend follower I still have to give the bullish case the benefit of the doubt. That being said, the S&P 500 and Dow Industrials are at least attempting to build a multiple top formation (See Figure 14). The Nasdaq 100 and Russell 2000 are nowhere close to their recent highs. 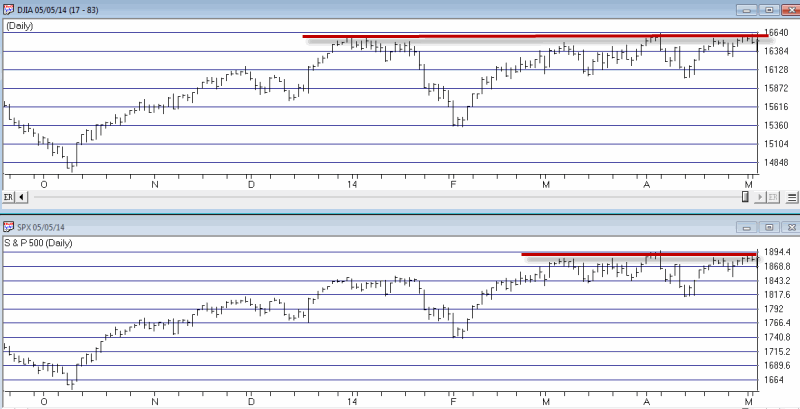 Figure 14 – Will SPX and DJIA break out or break down?
So if the market breaks down in the next week or so, given:
*The time of year
*A multiple top formation for the S&P 500 and Dow
*A negative weekly MACD
A little bit (or maybe even a lot of bit) of caution may be in order. as always, time will tell.
Jay Kaeppel


Very interesting observations. Thanks for the 40+ year look back. Add to all this the daily SPX and COMPQ look like classic H&S formations since 1 Jan, and you have many reasons to be bearish. Just don’t pull the trigger until you see a break.