See Jay’s recent post: Will Natural Gas Soar With the Wind in June?
If you are an ardent believer in the phrase “if something looks too good to be true it probably is”, then you’d better brace yourself. Because a “sure-fire, can’t miss, you can’t lose” thing is on the horizon in natural gas. Well OK, at least that’s the theory.
A Bearish Seasonal Trend in Natural Gas
The bearish time period in question extends:
a) From the close of trading on the 11th trading day of June (Friday, June 15 in this case)
b) Through the close of the 14th trading day of July (Tuesday, July 21th).
Here is the chronology of natural gas performance during this time period:
*Natural gas futures started trading back in April 1990. During that year, natural gas lost $790.
*During 1991 and 1992 however, natural gas gained $200 and $1,850, respectively. Things got “a little worse from there”.
*During the next 19 years, natural gas futures declined during the bearish period described above. Yes, you read that right – 19 consecutive years.
*Then like I fool I wrote about this trend in early June of 2012. See if you can guess what happened that year? Can you say, “A sharp advance (over $6,000 per futures contract) in the price of natural gas”? Sure, I knew you could.
*After that humiliation, everyone forgot I mentioned it and things went back to form with natural gas declining in 2013 and getting clobbered in 2014. So in a nutshell, this period has seen natural gas decline in 21 of the last 22 years.
So for the record, since 1990, natural gas futures during the June TD 11 through the July TD 14 period showed:
-A decline 22 times (88.0% of the time)
-A gain 3 times (12.0% of the time)
-The average declining period was -$5,580
-The average gaining period was +$2,730
The cumulative equity curve generated by holding a long position in natural gas futures only during this time period from 1990 through 2014 appears in Figure 1. Figure 1 – Cumulative gain from holding a short position in Natural Gas futures during bearish time period (1990-2014)
Figure 2 displays the year-by-year results.
Figure 2 – Yearly results from holding a short position in Natural gas futures during bearish period (1990-2014)
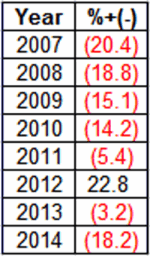
Ticker UNG is an ETF that ostensibly tracks the price of natural gas. UNG started trading in 2007. Figure 3 displays the net change in price for UNG during the aforementioned bearish period each year.
Figure 3 – Percentage gain or loss for ticker UNG during bearish period
Now let’s be honest, that’s a pretty good track record no matter how you cut it. Of course, that’s the good news. The bad news is twofold:
1) These historical results in no way “guarantee” that a short position in natural gas during this bearish period this time around will actually make money.
2) I mentioned this trend again. And of course, you can see in Figure 1 what happened the last time I mentioned this trend…………In the immortal words of Crosby, Stills, Nash & Young – “Paranoia, it strikes deep.”
How to Play This Trend
I will visit this topic when we get a little closer to June 15th.
Jay Kaeppel


