New Video Release: How To Find Longer-Term Bull Call Spreads

JayOnTheMarket.com is pleased to announce the launch of a new educational video for option traders with the release of “How to Find Longer-Term Bull Call Spreads”.

This 60 minute video features market veteran Jay Kaeppel, the author of “The Four Biggest Mistakes in Option Trading” and “The Option Traders Guide to Probability, Volatility and Timing.”  The premise is that too much of current option trading education teaches people “about trading”, but does not specifically teach people “how to trade.”

“How to Find Longer-Term Bull Call Spreads” fills this void by focusing solely on one specific option trading strategy – the Bull Call Spread – and will take you from start to finish, detailing specific actions to take every step of the way.

For more information, click this link http://jayonthemarkets.com/new-video-course/

Financial Armageddon (and Other Financial News)

Well according to reports that I have read, we are a little over a week away from Financial Armageddon, or at least that is what we are told will unfold if Congress does not raise the debt limit by October 17th.  For if the debt limit is not raised by that time then the Fed will be unable to pay its bills (the 17 trillion dollars of debt that we already owe simply represents bills that we are “unwilling” to pay – which apparently is different than bills we are “unable” to pay), which means the U.S. Government may default and that the whole “Full Faith and Credit” thing will suddenly become worth approximately “a bucket of warm spit.”  OK, that’s the Bad (granted, Very Bad) News.  But there are two pieces of good news.

First, the financial markets are so far taking financial Armageddon pretty darn calmly.  Sure the stock market is down a little bit of late, but overall it appears to be doing its best Alfred E. Nuemann (“What, Me Worry?”) impersonation.  As a side note, I can’t quite figure out what the “Flight to Quality” crowd will do once the treasury defaults. I can’t help but think that half of them will buy treasury bonds anyway just as a reflex and because they don’t know what else to do (Old dogs, new tricks, if you get my drift).

The other piece of good news is that our elected politicians are “hard at work” attempting to solve this problem (Granted our elected officials appear to have a “slightly” different definition of “Hard at Work” than the rest of us shlubs).  Whatever else you can say about them, our politicians are definitely busy engaging in politics these days.  Nothing that will do any of us any good, granted, but hey, this whole “We the People” thing is getting just about as outdated as that whole “Full Faith and Credit” thing.  So perhaps they are simply planning to wipe out both of these “antiquated” concepts in one fell swoop (at least that’s the only explanation that comes to mind).

When I think of our president and Congress I keep envisioning that image of those guys playing poker in the lounge of the Titanic.  Sitting there at a 45 (and ever increasing) degree angle, they remain focused on what they considered to be the most important thing – “Hey, I think I can win this hand!”

Of course as we all know, all of this is completely and entirely the fault of [your least favorite political party here].  And no one can tell anyone otherwise.

What to Do, What to Do

 Needless to say, everyone is pretty much assuming that something will happen at the 11th hour that will allow us to avoid “Shock and Awe, and Not in a Good Way” to our economy.  Otherwise there might be just a tad more concern being reflected in the financial markets.  Still it might be wise to think things through just a bit and to avoid “the conditioned response.”

Some of you may recall the utter “fear and loathing” that preceded the heavily anticipated “Fiscal Cliff” that we were going to plunge off of on January 1st of 2013.  How did that work out?  With a 20%+ gain in the stock market in the ensuing 8 months, of course.  So there is a certain part of us that is now conditioned to believe that “potentially economically catastrophic events” lead to “above average returns”, which I am not entirely sure is the proper lesson.  If nothing else, it’s a pretty small sample size.

So should investors simply take solace and assume that “things will work out?”  Or is some sort of “defensive action” in order?  At this point I think it is wise to invoke that age old bit of wisdom that states, “Hope for the Best, Prepare for the Worst.”  At this point there are two basic theoretical scenarios:

1. A deal is reached to avoid a U.S. default and stocks bounce and bonds do not collapse.

2. The U.S. does default and stocks and U.S. treasury securities tank.

If you are a typical investor with a typical allocation of your portfolio to stocks then you don’t really need to “do” anything to take advantage of scenario #1.  So that was easy.

Scenario #2 is “a little trickier”.  There is a school of thought that states (probably accurately) that if the U.S. does default on its debt there will be far bigger problems than your stock portfolio.  And that may be true.  But in this worst case scenario it is not like the stock market will close down for good, the economy will (immediately) grind to a halt and we will all begin just “living off the land.”  So “just in case”, it might make sense to “hedge.”

One Possibility

As I have written about recently, my new favorite hedging tool (for hedging specifically against an adverse move in the stock market) are call options on ticker VXX, the exchange-traded fund that ostensibly tracks futures contracts on the VIX Index.

The bottom line is simple to understand:

-When the stock market goes down, the VIX Index goes up.

-And the harder the stock market falls, the more quickly the VIX Index “spikes”.

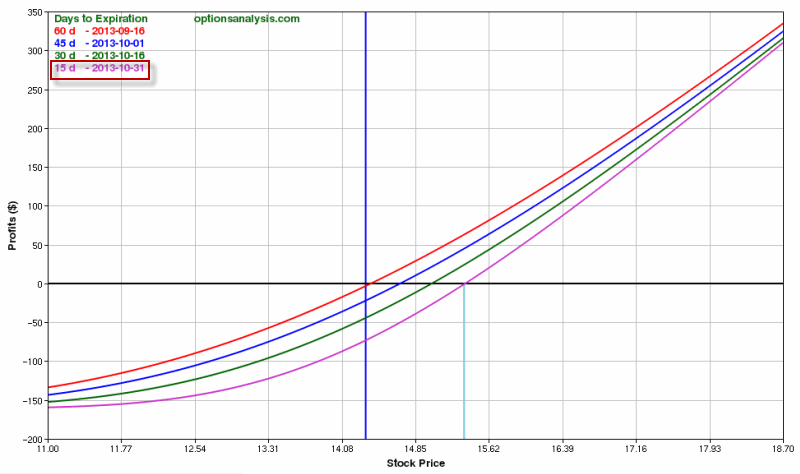
So if you have concerns about a stock market decline then a cheap VXX call option can offer some pretty good upside potential.  A trade that I highlighted recently involving VXX call options appears in Figures 1 and 2.  (http://jayonthemarkets.com/2013/09/17/looking-to-vxx-just-in-case/)

20131007-01  Figure 1 – VXX Nov 14 Call Option (courtesty www.OptionsAnalysis.com)
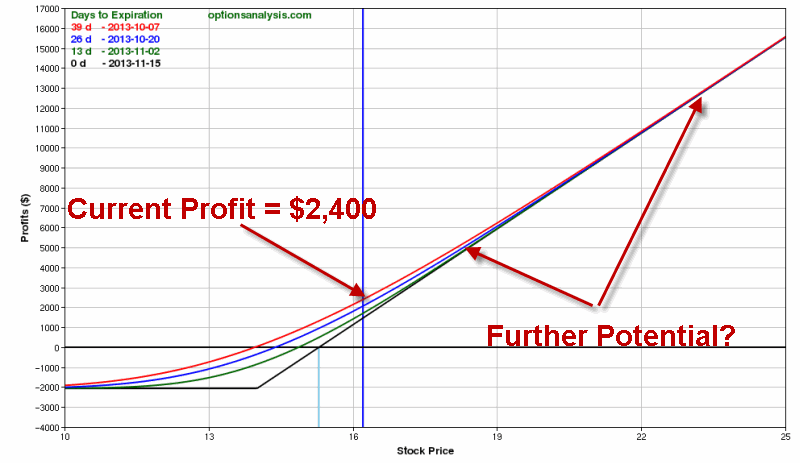
20131007-02  Figure 2 – VXX Nov 14 Call Option Risk Curves (courtesty www.OptionsAnalysis.com)

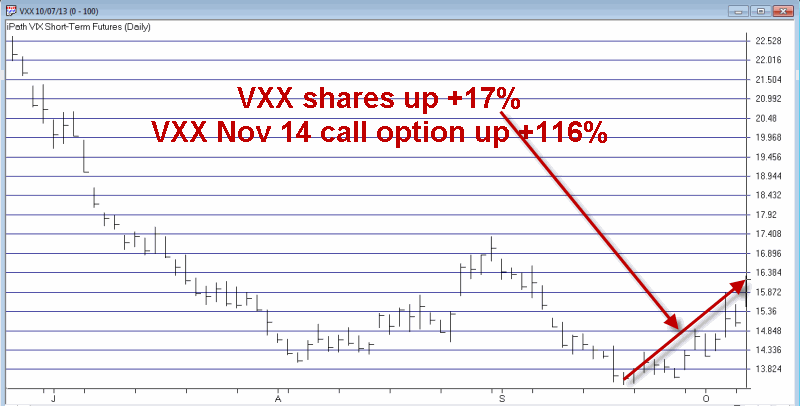
As you can see in Figure 3, VXX has rallied from 13.84 to 16.21, or +17%.  In the same time the VXX call option shown in Figures 1 and 2 have advanced +116%.  This clearly illustrates the potential benefit of leverage in the options market. 20131007-03 Figure 3 – Ticker VXX (exchange=traded fund) bounces recently (courtesty AIQ TradingExpert)
How high could VXX go if the U.S. somehow manages to default?  Figure 4 displays the longer-term history of the VIX Index itself.  20131007-04 Figure 4 – The VIX Index; How High Can it Go?  (courtesty AIQ TradingExpert)
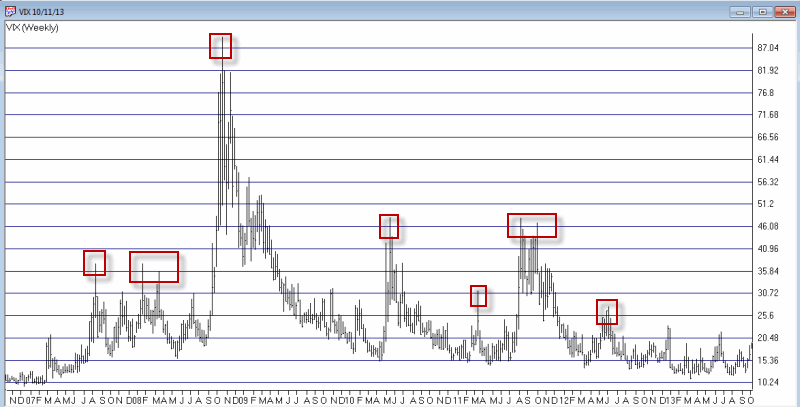
Just to “go to extremes”, if we had another meltdown along the line of 2008 and if ticker VXX rallied to 80, the November 14 VXX call option would be worth $66 a contract, or a gain of about +5,000% from the initial price on 9/20 (about +2,265% from current levels).

The Irony  

The ironic part is that as exciting as a potential gain of 2,000 to 5,000% sounds, we absolutely, positively hope that it doesn’t happen.   In fact, in the overall best case scenario these VXX call options expire worthless as the stock market rallies and volatility subsides.

What we hope is that our esteemed elected officials will get their act together and come up with a solid long-term plan to put the U.S. back on solid financial footing.

Or at the very least, that they avoid making us Thelma to their Louise.

Jay Kaeppel

Announcing New Video Release: “How to Find Longer-Term Bull Call Spreads”

http://jayonthemarkets.com/new-video-course/ 

Mommy, Why Do They Call October “Crash Month”?

Despite what the headline says, this is not one of those “Gloom and Doom” or “Sell Everything” articles.  It simply serves to remind that this is not the worst time in the world to think about hedging your stock portfolio.  First off, in case you have been tied up for the past 48 hours attempting to sign up for Obamacare, simply note that it is now the month of October.  Now over the long-term the stock market has actually gained ground during October.  But there is a reason that people refer to it as “Crash Month”.  A number of stock market, um, “declines”, both large and “merely painful” have played out in the past during October.

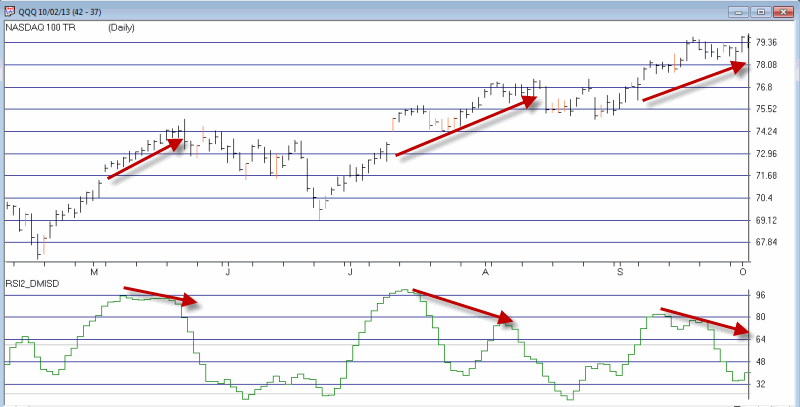
Will this be “one of those Octobers?”  Probably not, but…….for those who hold some belief in “The Power of the Negative Divergence”, there is some reason for concern.  In Figure 1 you see ticker QQQ which tracks the Nasdaq 100.  On 10/1 it closed at a new multi-year high.  Whoohoo!  As a “go with the flow” kind of guy and as a big believer in the “power of the trend” please understand that I am not attempting to “call the top”.  I am merely pointing out the potential for a, ahem, “meaningful pullback.”

Under the bar chart in Figure 1, I have plotted an indicator I created (in truth I took two indicators from other people and simply mashed them together) called RSI2_DMISD.  Now if I could remember what that acronym stands for exactly I would tell you, but for now simply note that this indicator does a pretty good job of “negatively diverging” near tops.

20131003-01

Figure 1 – Negative Divergence between indicator and price action (courtesy: AIQ TradingExpert)

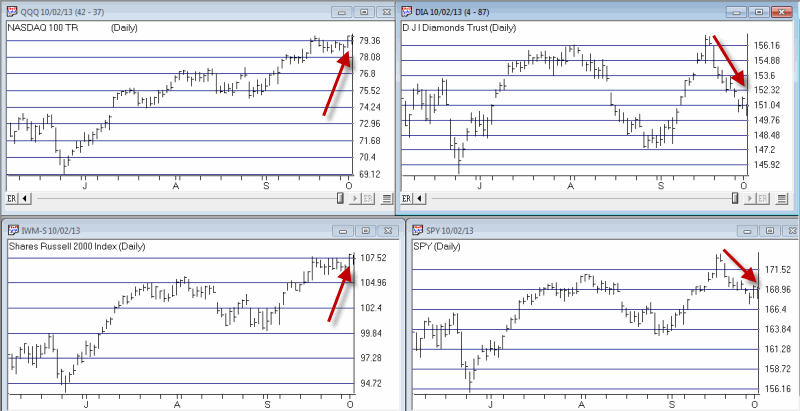
As you can see, RSI2_DMISD came nowhere close to making a new high on 10/1.  Does this mean the market is “doomed?”  Not at all.  But it does offer a word of caution.  In addition, in Figure 2 we see that while QQQ and IWM (that tracks the Russell 2000 small cap index both made new highs, the large cap indexes represented by ticker DIA and SPY did not.  This represents another form of bearish divergence.

20131003-02 Figure 2 – Nasdaq and Small-Caps touch new high; Large-Caps not so much  (courtesy: AIQ TradingExpert)

Summary

As an avowed “trend follower” it is not in my nature to shout “sell everything”.  It is however, in my nature to shout “Hedge” every once in a while (and boy do I get some funny looks at the grocery store).  This is one of those times. 

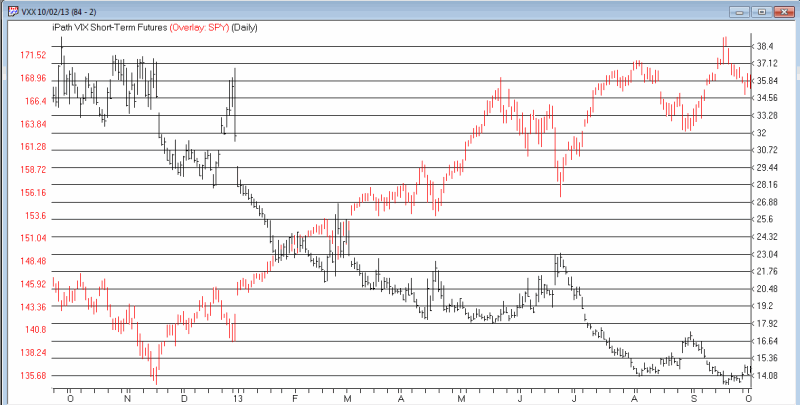
My favorite play is still to hold call options on ticker VXX which track the VIX Index.  In Figure 3, the VXX has not moved up much even as the S&P 500 has declined of late.  If anything “negative” happens during October we have every reason to expect VXX to “spike” higher. 

20131003-03

Figure 3 – VXX has room to move higher  (courtesy: AIQ TradingExpert)

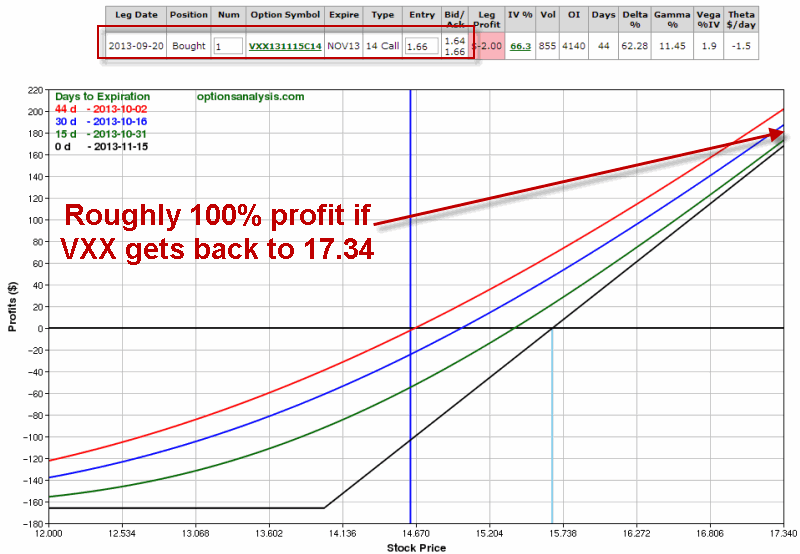
If VXX were to merely bounce back up to its most recent high of 17.34, the November VXX 14 call would roughly double in price.  20131003-04

Figure 4 – VXX November 14 Call Option  (courtesy: www.OptionsAnaysis.com)

At $166 a contract, this represents a pretty good and inexpensive hedging opportunity.  On the flip side, if nothing “bad” happens during October, this option can be sold on October 31st to salvage some of the premium.

Jay Kaeppel


(Part II) Gold Stocks and the Month of October

In my last post (http://tinyurl.com/m8pdr5k) I pointed out that gold stocks (as measured using Fidelity Select Gold, ticker FSAGX) during the first 19 trading days of October have declined 17 times in the past 24 years (roughly 71% of time) with a net loss of -76.5%.  Now if you are like most people – myself included – your initial reaction may well be to assume that gold stocks will decline during October of 2013.  But the reality is that that is not necessarily the case.  It just means that in the past the odds have favored the gold stock bears during this time frame.

So the obvious question then becomes “what to do with this knowledge?” One possibility of course is to do nothing.  If you have no position in gold stocks right now perhaps you might just hold off for awhile.  Another possibility for more active traders is to attempt to play the short side. In this case the questions are slightly different from my last post.  They are:

1. Which specific trade will I take to play the short side of gold stocks?

2. How much capital will I allocate?

One “exciting” possibility is to buy ticker DUST, the triple leveraged inverse gold stock ETF.  And when I say “exciting” I mean like “bungee jumping off a bridge kind of exciting”, which is also to say “it is definitely not for everyone. ” In this case, the words “exciting” and “dangerous” are essentially interchangeable.  To illustrate consider this:

In yesterday’s table the “worst performing” (for a person playing the short side of gold stocks) first 19 trading days of October was 1993 when gold stocks rallied +14.5%.  So in theory, a person holding a triple leveraged inverse gold stock fund during that particular period would have lost over 40% in less than a month.  “Yippee Ki Ay, Mother, um, Fellow Trader.”

So if you choose to go that route, best of luck, but please make your answer to Question #2 above a very small number (Hint: 10% or less, at least in one man’s opinion).

One Other Possibility 

One other possibility (and as always and for the record, this is NOT a recommendation, just an illustration of one way to play), is to buy a deep-in-the-money put option on ticker GDX.  GDX is the Market Vectors Gold Miners ETF.  The purpose of buying a deep-in-the-money put option is to enter a position that will closely track an actual short position in gold stock shares (also not my own personal cup of tea) with limited risk.  Consider:

GDX November 2013 (Week 1) 28.5 put @ $3.80

20131001-01

Figure 1 – In-the-money put option on GDX (Source: www.OptionsAnalysis.com)

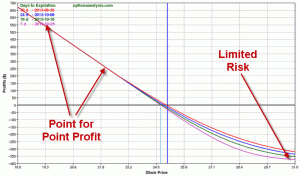
As you can see in the risk curves in Figure 2, this position enjoys limited risk if gold stocks decide to rally instead of decline.  In addition, with GDX trading at $25.02 a share, the breakeven price for this position is $24.70 (as of October Trading Day 19, or October 25th).  Below that price the put option will gain dollar for dollar with an actual short position in ticker GDX.

20131001-02

Figure 2 – Limited risk and point for point (vis a vis a short position in GDX shares) profit if GDX declines (Source: www.OptionsAnalysis.com)

Summary

 So is this “Jay’s Hot Pick” for October?  Sorry folks, the Marketing Hype Office is closed today.  This is simply an illustration of “one way to play” the short side of “something” when the odds suggest a decline is a possibility.  Also please remember that as I mentioned last time, gold stocks are one of the most beaten down sectors around, so an exception to the “gold stocks are bearish during October” meme should surprise no one. Therefore, if you do decide to play the short side of gold stocks during October, just remember not to “bet the ranch”.

That’s all I have to say about that.  On second thought, and in all candor,  if gold stocks do happen to plummet in the weeks ahead, I will probably mention this trade again.

Sorry, it’s just my nature.

Jay Kaeppel 

Gold Stocks and the Month of October

Well that didn’t pan out.  Gold stocks in September that is.  At the end of August I wrote about the historical tendency for gold stocks to perform well during the month of September (For the record, I also highlighted the fact that monthly seasonal trends are always far from a “sure thing” and that there is never any guarantee that a particular seasonal trend will work out “this time around.” Hey, at least I got that part right).

Still, whenever you write about the historical tendency for a given stock/index/commodity/etc to move in a particular direction during a particular period you expect at least a little cooperation.  Not this time.

With one trading day left in September gold stocks have proven to be just about the worst place you could have been during September 2013.  As I write both tickers FSAGX and GDX are both down over 10% for the month.  Ouch. 

So should I issue an apology, and blather on about “where my analysis broke down” and “what I should have done differently” and so on?  Maybe, but in reality a seasonal trend by itself is nothing more than a play on the odds.  Sometimes it works out, sometimes it doesn’t.  Fortunately, I have been around the markets long enough to know that, well to paraphrase – “stuff happens.”  Which I think is fairly succinctly captured in:

Jay’s Trading Maxim #20: The markets don’t always do what you want them to do.  Deal with it.

I have also been around long enough to know that it is your own responsibility to make sure that things that go completely and utterly and entirely the wrong way are not allowed to do too much damage to your trading account.  So when it comes to potential trades based on seasonal trends (and come to think of it, just about any other trading method), the two questions to ask are:

1. Am I going to take the trade?

2. How much capital will I allocate?

Allocating capital, i.e., “money management”, is one of those “boring” topics that makes everyone’s eyes glaze over.  Which is a shame given that it is one of the most critically important pieces of business for any trader or investor to take care.

For example, consider again gold stocks in the month of September.  If a trader had allocated 20% of his or her trading capital to gold stocks in the last month, they would have lost about 2% of their account.  Not good obviously, but also not exactly catastrophic.  Now consider the trader who decided to “roll the dice” and “bet the ranch” and “go for the gusto” and [your euphemism here] and put 100% of his or her trading capital into gold stocks.  That trader just lost 10% in a month.  Ouch. 

Now as a sidebar and for the record, a 10% down month does not qualify as “catastrophic.”  It certainly qualifies for “Wow, that really sucks” status, but anyone who survived September/October of 2008 can at least acknowledge the fact that these things can be overcome in the long run.  Thus and ironically, the even bigger danger of a -10%+ month is the potential psychological damage that can affect your thinking the next time around (“Wow, I don’t want to experience that again, therefore, maybe I’ll just sit out the next trade – or 10.”  Also typically known as “the trades that would have made you whole.”)

So all of this leads to a few more key takeaways:

Jay’s Trading Maxim #48: Your biggest enemy in the markets are unexpected events.  Your 2nd biggest enemy is you.  Control the enemy you can and allocate capital wisely to control the enemy you cannot.    

Jay’s Trading Maxim #108: He who “bets the ranch” so to speak, invariably ends up “renting a small apartment” – so to speak.

OK, so you get the idea.  That all being cleared up – but with the painfully wrong result in September still at top of mind – it’s time to talk about gold stocks in the month of October.  Gulp.

Gold Stocks in the Month of October

So here we go again.  At the moment gold stocks are dirt cheap relative to the price of gold bullion (and have been for some time) and gold stocks are extremely oversold (granted they have been “oversold” for about nine months now), so it seems that gold stocks are long overdue for a sharp bounce to higher ground.  So given the potential for a sharp rally at any time and the spectacularly wrong result during the month of September, I am somewhat hesitant to point out the long-term historical performance of gold stocks during the month of October.  But hey, the show must go on.

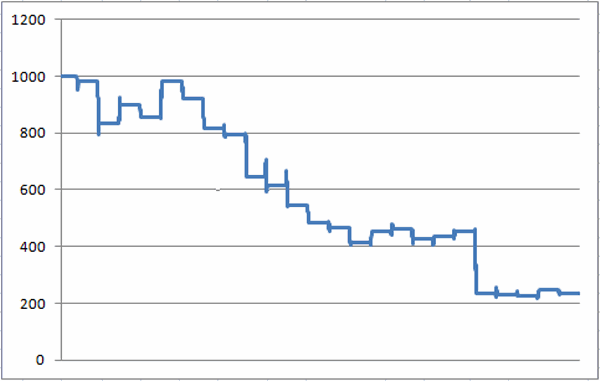
Figure 1 displays the, um, growth(?) of $1,000 invested in Fidelity Select Gold fund (ticker FSAGX) from the end of September through the 19th trading day of October starting in October 1988.

 20130930-01

Figure 1 – Growth of $1,000 invested in FSAGX from end of September through October Trading Day 19 (1989-2012)

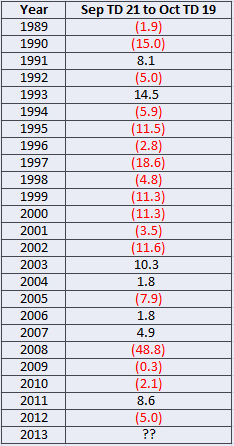
Figure 2 displays the year-by-year % gain/loss achieved by ticker FSAGX during the first 19 trading days of October

 20130930-02

Figure 2 – Year-by-Year FSAGX results from end of September through October Trading Day 19 (1989-2012)

For the record:

-Net loss: (-76.5%)

-# of times UP: 7 (29%)

-# of times DOWN: 17 (71%)

-Average % +/- all years (-4.9%)

-Average % gain during 7 UP years: +7.1%

-Average % loss during 17 down years: (-9.8%)

Summary

So are gold stocks destined to decline between the end of September and the close on October 25th (the 19th trading day of October 2013)?  Didn’t we learn anything this past month?  Nothing is guaranteed in the financial markets, especially when it comes to seasonal trends.  All we know for sure is that over the past 24 years this period has witnessed a decline in gold stocks 71% of time. 

This leads us right back to the two questions I posed earlier:

1. Am I going to take the trade? (more on this in the next post)

2. How much capital will I allocate?

Same as it ever was.

Jay Kaeppel 

Predictions are ‘Fun’ (But Trends are ‘Useful’)

Predictions are fun.  Not terribly useful, granted.  But fun.

In every field of endeavor there are people who are considered “visionaries”, i.e., persons who are able to envision how certain futures trends and events will unfold and are able to articulate their “vision” in advance of said trends and/or events.  A great example of this is the late Steven Jobs.  Jobs (in case you just recently awakened from a coma, in which case, “welcome back”) was the driving force that led Apple to introduce a series of breakthrough (and wildly popular) products in the field of personal electronics.  But to say that Steven Jobs was an exception to the rule would be a minor understatement.

Unfortunately, there is something about the financial markets (quite possibly the lure of easy money) that seems to inspire people to make what seems to be far more predictions than in most other fields.  For every prediction Steven Jobs ever made about the future of personal electronics, there were approximately 6,256,375 random predictions made at about the same time regarding the stock market. 

Equally unfortunately, for every 6,256,375 financial market predictions made, approximately 6,256,368 of them don’t pan out.  In a nutshell, the “winning percentage” for financial market predictions is so low you essentially have to go underground to get an accurate reading.  Ironically, this doesn’t seem to deter anyone from “trying again.” (In the immortal words of Glenn Frey, “the lure of easy money – it’s got a very strong appeal”).  Indeed.

So what is an intrepid investor to do?  Well, for starters, consider the following:

Jay’s Trading Maxim #37: Recognizing the trend right now is worth far more than a thousand predictions on what will happen next.   

This is a more succinct version of the earlier version which stated:

Jay’s Trading Maxim #37: It’s really hard to predict what’s going to happen in the stock market over the next [insert your preferred time frame here].  And when I say “really hard” I mean “really, really hard”.

These particular maxims evolved from a recurring and disturbing pattern of events that basically went something like this:

1) One guy would predict that the market would go up over the next x-months.  And in fact it actually would.

2) Suddenly everyone – myself included – couldn’t wait to hear what this “oracle” had to say next.

3) Maybe he would get another call right, but eventually he would get it almost exactly and completely wrong – either confidently advising everyone to “buy” just before a big market drop, or shouting “SELL” right before – you guessed it – the next big rally.

4) Then everyone would scurry off to follow another advisor who had correctly “predicted” the rally that the last guy had missed.

5) So on and so forth, repeat, ad nauseum, ad infinitum.

So what’s an investor/trader to do?

#1. Respect the trend

To truly appreciate “the power of the trend”, pause for a moment and reflect on all of the economic and political news that you have digested so far during 2013.  Now consider the action of the stock market so far in 2013.  Let me sum things up as succinctly as possible:

News: Bad

Stock Market: Good

This juxtaposition makes little sense to many people.  “If the news is all bad and the economy is still not really picking up (and so on and so forth), it’s just a matter of time before the stock market figures this all out and tanks.”

And perhaps that will ultimately prove to be true.

But take one more look at the action of the stock market in 2013 and think about what an investor would have missed had he or she succumbed to fear.

In the end, ignoring the news and simply respecting the trend was the thing to do.

Same as it ever was.

#2. Recognize Historical Tendencies

 OK, here’s where it starts to get tricky.  First off, clearly all trend experience pullbacks along the way.  At the present time a person would be hard pressed to say that the stock market is not in an uptrend.  And based on everything I have said so far one might assume that I would simply say “play the long side” of the market and forget the blips.

But like I say, even the most obvious trends experience pullbacks.  Also, if at the outset of any calendar year you asked the question, “when is the stock market most likely to experience trouble”, the answer of “September and/or October” would have been correct a high percentage of the time.

So here we sit in late September.  Most of the major averages have broken out to new highs and the Fed just announced QE2IB (“Quantative Easing to Infinity and Beyond”).  So alot of the people who have been focusing in the bad news all year are reaching a point of “bear exhaustion.”  In other words they are saying “OK, OK, the trend is bullish, I get it.”  Given this confluence of factors no one should be surprised to see the stock market pullback in the weeks ahead.

Still, out of respect to the primary trend I prefer to “hedge” rather than to pound the table and shout “sell everything”!  (Although for the record there is something cathartic about actually pounding on the table and shouting “sell everything!”  Go ahead, try it once, you’ll see what I’m talking about). I still like the idea of holding VXX calls as I wrote about here (http://jayonthemarkets.com/2013/09/17/looking-to-vxx-just-in-case/. If the stock markets does have a sell off in its near futures, the VIX Index will almost certainly “spike” to higher ground, and VXX call options have the potential to soar.  As I write the November 14 VXX call is trading at $1.42.  Not a bad hedge for $142.

Jay Kaeppel 

We’re All Just FedHeads Now……..

I have to admit that I am getting a little frightened.  While the masses (I think you know who you are) celebrated yesterday’s Fed announcement (for the record, the phrase QE, or “quantitative easing” is out, and QG, or “quantitative gushing” is in, mostly because it is more succinct than QFH, or “quantitative fire hosing”) that the easy money will continue to, um – somehow “flow” does not seem like a strong enough word – the stock market’s Pavlovian response to “another round of punch”, so to speak, sets up an even darker prospect for that day that is most assuredly “out there”, when the Fed finally says, “no more for you”.

Picture a room fool of crack addicts and every month the dealer walks in and announces “more free crack for everyone!”  If you are having trouble visualizing it, just think of yesterday afternoon in the stock market.  Now the one thing we know for sure in all of this is that someday the Fed will have no choice but to “taper.”    Which raises the “mildly important” question: If the masses react in a wildly bullish Pavlovian manner when the Fed “giveth”, then can we make a reasonably intelligent guess as to how the market will react when the Fed “taketh away?”  “Yes we can.”

So picture that same room full of crack addicts again.  Now this time imagine the dealer walks in and announces “sorry, no more crack for you.”  Now picture what happens next in that room.  Now picture that happening in your 401K……..

The VIX and Gold Stocks

In recent posts I reaffirmed my bullishness (http://tinyurl.com/kx27bpn)on gold stocks and highlighted a simple “throwaway” hedge using call options on ticker VXX (http://tinyurl.com/k8gedgy).  Well obviously, the “hedge” trade using VXX was a bust as volatility tanked when the “(Pavlovian) dogs started barking.”  But the option only cost $161 so I am inclined to let it ride “just in case” the revelers sober up sooner than expected.  As a side note, that’s the purpose of a “hedge”.  You risk a “couple of bucks” on the chance that it will pay off big if things go “the other way.”

On the other side of the coin, gold and gold stocks went – for lack of a better phrase – “berserk” after yesterday’s Fed announcement.  As I type in the “wee” hours, gold futures are $75 above their recent low a few days ago and ticker NUGT – the triple leveraged (speaking of “crack like investment things”) gold stock ETF – was up over 27% yesterday alone.  “Alex, I’ll take Inflationary Fears for $100.”  Hey, wait a minute.  If Fed easing (“gushing?”) is inflationary then why is the stock market going wild?  Oh well, who am I to question why?

Summary   

I am by and large a “go with the trend” kind of guy.  So while I can voice my own (and I am guessing that for a lot of you, your) fears, the reality is the trend of the stock market is “up” (in case you hadn’t noticed).  But do keep your eyes peeled between now and the end of October.  Key price levels:

QQQ: 78.72

SPY: 171.24

IWM: 106.08

These are the 9/16 highs that were obliterated yesterday.  Watch to see if the market runs out of gas and these ETFs fall back below those levels.  While I have always been hesitant to use phrases like “blown it’s load” (as in “the market has”) when attempting to write a professional piece, oddly, it seems that it may be appropriate here.  So to close simply note that now is a time to be paying close attention to the action of the market.  Enjoy the ride but don’t forget to look down once in a while.  Which leads us directly to:

Jay’s Trading Maxim #46 which clearly states: “Don’t gaze at the stars while sprinting.”

Forward, Fellow Fedheads!

Jay Kaeppel

Looking to VXX – Just in Case

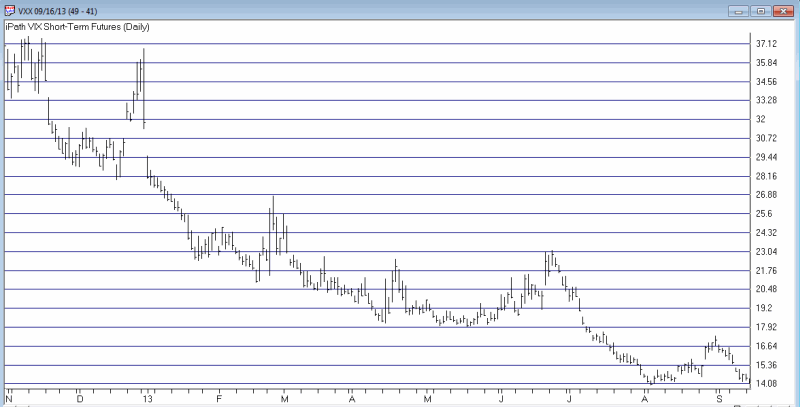
In Figure 1 below you will see a chart of ticker VXX, an ETF that tracks the VIX Index. 

jotm20130917-01  Figure 1 – Ticker VXX (Chart courtesy of AIQ TradingExpert)

Given:

  • The fact that September and October have historically been the scene of a lot of stock market wreckage.
  • That the Fed is due to say “something” about tapering soon
  • The fact that VXX is at about its lowest level in years
  • And the fact that VXX “spikes” to higher ground when the stock market stumbles.

Does it seem at all possible that VXX might be about ready for its next “spike”?  Now understand that that is not a prediction but merely an observation that the possibility seems “ripe”.  So it might be time to consider what I sometimes refer to as a “throwaway” trade.

My definition of a “throwaway” trade is one whereby based on the “possibility” of “something” in particular occurring, one enters into a very low cost trade that has the prospect of paying off in a big way based.  But do not confuse this with a “lottery ticker” mentality, because the trade is based on some realistic expectation that the “something” might actually occur.  Is it really that hard to picture a VIX spike sometime in the September/October timeframe?

So here is one example possibility (though not necessarily a recommendation) using an option on VXX.  This trade was found using software at www.OptionsAnalysis.com.  It involves simply buying 1 November VXX 14 strike price call option for $161.  The particulars appear in Figures 2 and 3. 20130916-02

Figure 2 – VXX November 14 Call Option (courtesy www.optionsanalysis.com)

jotm20130917-03

Figure 3 – VXX November 14 Call Option (courtesy www.optionsanalysis.com)

If VXX were merely to return to its August 30th high of 17.34, this trade would essentially double in value.  If “something” really crazy happens and VXX soars to sharply higher levels the profit could be quite a bit more.

Again, I am not saying that VXX is sure to soar between now and the end of November.  I’m only saying that I might be willing to risk $161 just in case.

Jay Kaeppel

The End of September…or Once More into the Fray

I have written often about seasonal trends in various financial markets.  I have highlighted many trends that have worked well over time – with the key words in that sentence being “over” and “time”.  Because, obviously nothing works all the time.  For example, historically the month of September has been very good for gold stocks and very bad for the stock market.  How’s that working out this time around?  So far, gold stocks are down about 9% since August 30th and the S&P 500 is up +3.3%.

So do we chalk it up as an “off year” for September seasonal trends in gold and stocks?  Maybe.  But then again, maybe not so fast.  Because both of these markets have previously exhibited something of a split personality during the month of September.  Let’s review.

Figure 1 displays the performance of gold stocks (using Fidelity Select Gold, ticker FSAGX as our benchmark) during two different periods.  The blue line represents the growth of $1,000 invested in gold stocks during just the first 8 trading days of September starting in 1989 and extending through the 8th trading day of September, 2013.  20130916-01

Figure 1 – Growth of $1,000 invested in gold stocks (ticker FSAGX) during the first 8 trading days of September (blue line) versus all other September days (red line) since 1989

For the record:

-The first 8 trading days of September has showed a gain only 14 out of 26 years, with a cumulative gain of +7.4% (which works out to an average gain of +0.86%).

Trading days 9 through 21 of September has showed a gain 17 out of 25 years, with a cumulative gain of +167% (an average gain of +4.52%).

So I am not giving up on gold stocks in September just yet.

As for stocks, as I wrote about here (http://tinyurl.com/mtez9cw) the stock market has displayed a strong tendency to decline after the 11th trading day of September (Tuesday, Sep. 17 this year) through the end of the month.  So with QQQ breaking out to new highs as I write, it comes down to this: if the market fails to sustain the breakout above last week’s highs in the next several days, no one should be surprised to see the market decline into the end of the month.

When you also factor in anecdotal “things” like the Fed scheduled to “speak” about tapering and a bull appearing on the cover of Time magazine (que the scary shower scene music)  a little bit of hedging (with put index options or VXX call options) would appear to be in order if the market drops back below the highs of the week ending 9/13/13.

Jay Kaeppel

My Thanks to Trader’s Library

I had the pleasure of speaking at the Trader’s Library Trading Forum this past weekend on one of my favorite topics – seasonal trends in the markets.  My thanks to all those in attendance.  As an instructor there is nothing better than having the opportunity to teach people who really want to learn more about who to improve their trading.

It was also great to mingle with the other speakers and to sit in on their presentations.  I like to fancy myself as a guy who knows a lot about markets and trading.  Silly me.  It is a good and humbling experience to be reminded once in awhile of just exactly how much you still don’t know, as I learned during a number of sessions this past weekend.

Finally, my thanks to John Boyer and his staff, with a special shout out to Danielle for all of her help in making it so that all I had to do was show up and start talking.  A true professional.  And I was reminded that – as in any organization – it is the people who “handle the details” who really make the difference.