It Doesn’t Have to be Rocket Science (Part 312)

Seems like I have used this title before.  That’s probably because I have.  It’s also because every once in awhile I lift my head up from “crunching numbers” – in pursuit of that “one great market timing method” – and remember that there really is no such thing and that having a general sense of the overall trend of the markets and adding a touch of common sense can get you pretty far as an investor and trader.

Of course, that’s been easier said than done of late.  At times its seems that common sense would dictate doning a Hazmat suit and curling up in the fetal position in a corner until – you know, whatever – passes.  With an election coming up we have been informed by both sides that if the other side wins then that will pretty much be the end of humanity as we know it.  Which leaves us exactly where?  But I need to watch my blood pressure so I will steer clear of politics.

My Writing (or Lack Thereof) of Late

I have been writing very little of late.  The good news for me is that JayOnTheMarkets.com is not a paid site and there are no deadlines and no one is waiting for me to tell them what to do next in the markets.  Which is probably a good thing since the truth is that I have never been more unsure of exactly what the h?$% is going on in the markets (or the world around us, come to think of it) than I have been of late.   Hence the lack of more frequent updates.  As the saying goes, “If you don’t have something intelligent to say, don’t…” – well come to think of it I have never really adhered to that rule in the past.  Never to late to start, I guess.  In any event, thank goodness I am a systematic trader.

In trying to make sense of things, on one hand a perusal of the evidence in recent months led me to think that a major top was forming.  On the other hand, the trend (except for a recent short-lived dip by some of the major averages below their 200-day moving averages) has remained “up” and we are now in what has historically been a very bullish seasonal period (also the standard most bullish 6 months of the year starts on November 1st).  

So the bottom line is that if you want to be bullish you can make a pretty good case.  On the other hand, if you want to be bearish you can also make a pretty good case. 

What’s a guy or gal to do? 

Well hopefully your answer is the same as mine: Continue to follow your objective, well thought out trading plan – one that incorporates some risk controls in case things don’t go the way you planned. 

Sounds so simply when its put that way, doesn’t it?  Towards that end, let me offer a simple “Non Rocket Science” method for identifying the long-term trend of the stock market.

Jay’s Non-Rocket Science Stock Market Trend Identification Method (JTIM)

Notice that this ridiculously long title (hence JTIM for short) includes the phrase “Trend Identification” and not the phrase “Market Timing”.  If I were truly interested in full disclosure the title would actually be something like “Jay’s Non-Rocket Science Let’s Not Ride the Bear Market All the Way to the Bottom for Crying Out Loud” Method.  But that one was really long winded. 

The purpose of this method is simply this, nothing more, nothing less: to avoid riding an extended bear market all the way to the bottom all the while hoping that one day it will bounce back.  When this method gives a sell signal it simply means that it “may be” time to play defense.  That might mean selling a few stock market related holdings, that might mean selling everything related to the stock market, or it might mean hedging and existing portfolio.

It also means that there is a chance that you may take defensive action and later end up wishing that you had not.  Sorry folks, that just kind of the nature of trend following.  But one thing I have learned since, well, the time I had a lot of hair until now, is that selling now and buying back in at a slightly higher price is typically preferable to riding a 20%, 30% or 40% or more drawdown.

Now some people may respectfully disagree with that opinion.  But these types of drawdowns can scar an investor’s psyche – and adversely affect their judgement in the future – for  a long time – even after their portfolio eventually bounces back.  In addition, riding a massive drawdown like DiCaprio and Winslet riding the final plunge of the Titanic opens an investor to one of the most devastating mistakes of all – i.e., selling at or near the bottom (Though fortunately not to hypothermia like DiCaprio – and just for the record, seriously, couldn’t Winslet have just schooched over a little bit and made enough room for both on that door or whatever it was she was floating on? But I digress).

This reminds me to remind you of:

Jay’s Trading Maxim #78: Drawdowns make people act stupid (the more the drawdown, the more the stupid).

So here are the (granted, imperfect) JTIM rules:

*If the S&P 500 Index closes for two consecutive months below its 21-month moving average AND also closes below its 10-month moving average, the trend is deemed “Bearish”.

*While the trend is deemed “Bearish”, if the SPX 500 Index closes one month above its 10-month moving average then the trend is deemed “Bullish.”

That’s it.

JTIM Results

The results must be measured based on what the method is trying to achieve – i.e., avoiding massive, long term drawdowns – so as to avoid “acting stupid” (and to avoid ending up like DiCaprio, but I repeat myself).  Over the course of time the results look pretty good.  Of course, it also depends to some extent on how you define “good”, because from time to time – and over certain extended periods of time between the beginning and end – the results don’t look so good.  Allow me to explain.

In general terms, it goes like this:

Good: This method avoided most of the 1973-1974 bear market.

Not So Good: Between 1977 and 1991 there were 5 “sell” signals.  In all 5 cases an investor who “sold everything” based on these signals would have bought back in at a higher price.  An investor would have missed drawdowns of -9.6% in 1977-78 and -12.7% in 1981-82.  But all other sell signals during the great bull market of the 80’s and 90’s witnessed drawdowns of no more than -4.0%. 

Good: The last three sell signals (2000, 2002, and 2008) were followed by drawdowns of -28%, -29% and -50%, respectively.   

Figure 1 displays the results in tabular form:spx timing Figure 1 – Jay’s Trend Identification Method Signals
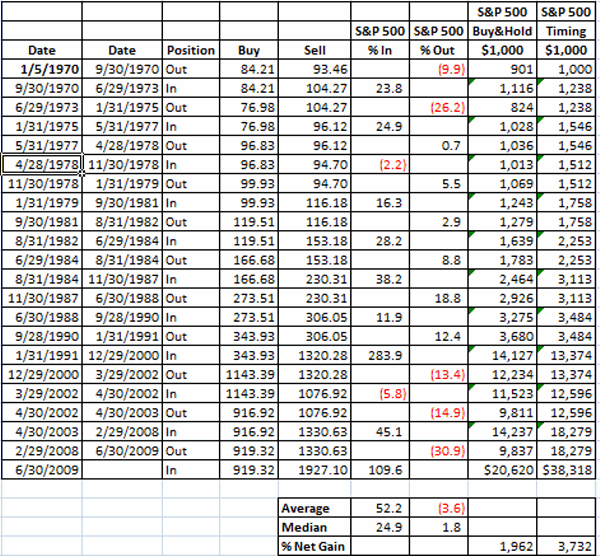
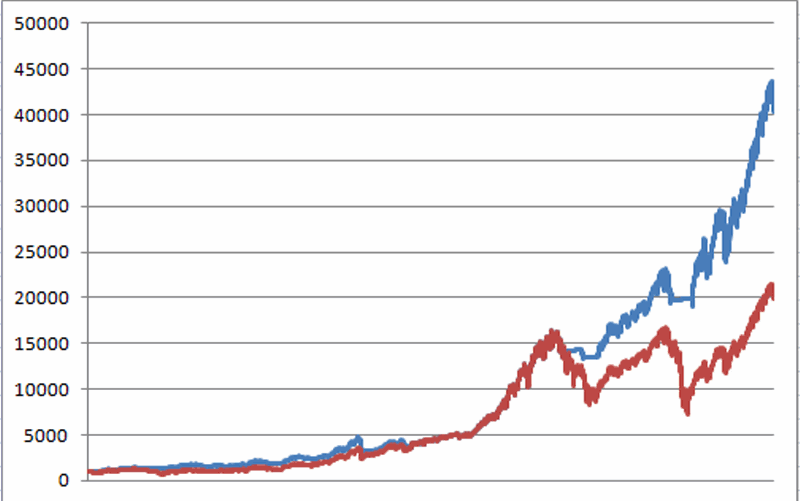
The key thing to note is that over the past 40+ years this method outperformed buy-and-hold (by almost 2-to-1 if interest earned while out of the market is added in; See Figure 6).

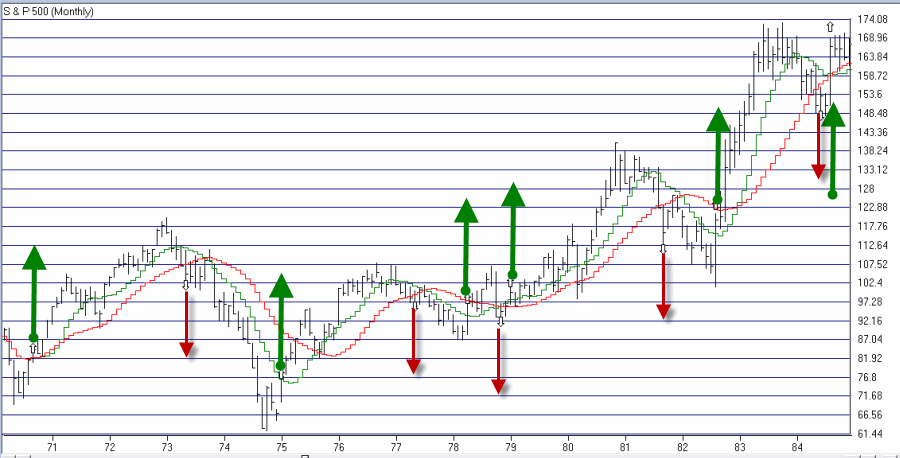
Figures 2 through 5 display the signals on SPX monthly bar charts. SPX Timing 1Figure 2 – SPX with JTIM Signals 1970-1984 (Courtesy: AIQ TradingExpert)
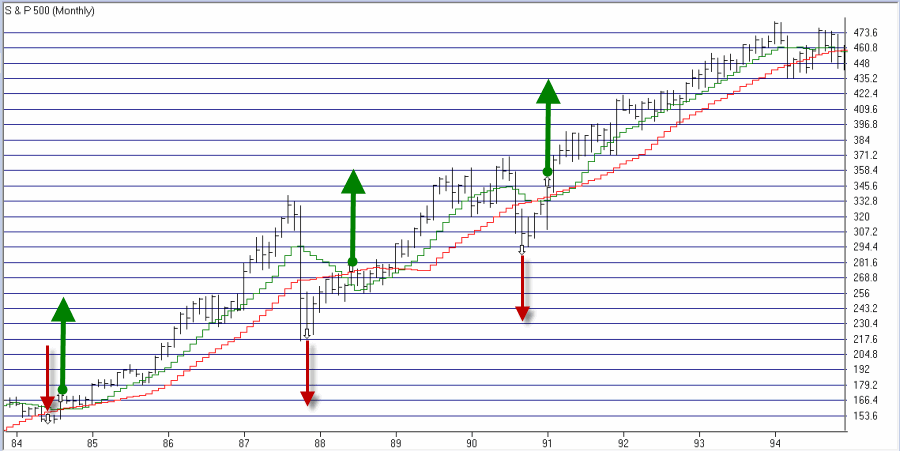
SPX 2 Figure 3 – SPX with JTIM Signals 1984-1994 (Courtesy: AIQ TradingExpert)
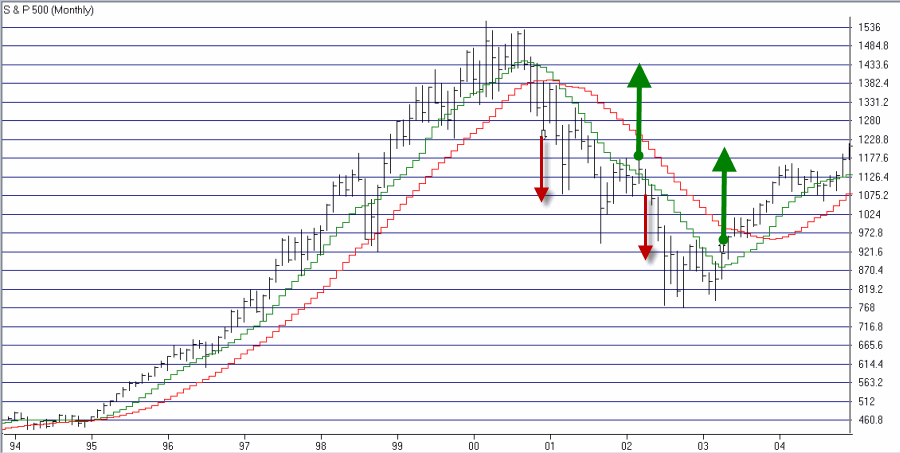
SPX 3 Figure 4 – SPX with JTIM Signals 1994-2004 (Courtesy: AIQ TradingExpert)SPX 4 Figure 5 – SPX with JTIM Signals 2004-2014 (Courtesy: AIQ TradingExpert)
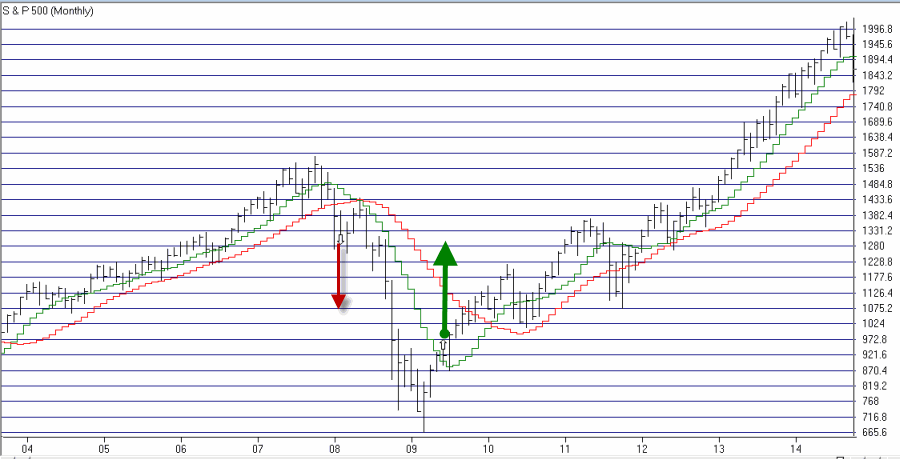
Figure 6 displays the growth of $1,000 using JTIM (adding 1% of interest per year while out of the market) versus buy-and-hold since 1970.Figure 6 Figure 6 – Growth of $1,000 using JTIM (blue line) versus buy-and-hold (red line) since 1970
And just to complete the picture Figure 7 displays the growth of $1,000 invested in SPX only when the system is bearish.  Figure 7Figure 7 – Growth of $1,000 when JTIM is bearish (1970-present)
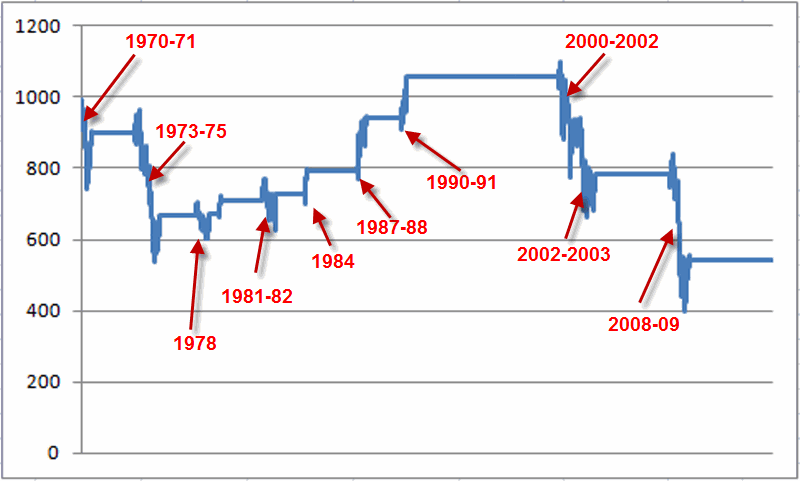
For the record, had an investor bought an held the S&P 500 only during those period when JITM was bearish since 1970, an intitial $1,000 investment would now be worth only $540 (i.e., a loss of -46%).  Or as we “professional market analysts” refer to it – Not So Good.

Summary

So is this the “be all, end all” of market timing?  Clearly not.  During most of the 80’s and 90’s, getting out of the market for any length of time typically cost you money.  Still, since nothing of the “be all, end all” variety actually exists  some investors may find it useful to note the status of this simple model, at the very least as an alert that:

a) a lot of bad news can typically be ignored if the model says the trend is “up”, and,

b) some defensive action may be wise if the  model says the trend is “down.”

Alright, excuse me, I have to get back into my Hazmat suit.

Jay Kaeppel
Light at the End of the Tunnel? (or do I hear a Train Whistle?)

Wow, does Murphy hate my guts, or what?

So I write an article all about how the stock market gets all bullish during the middle 18 months of the decade (September 30th – Mark Your Calendar) – i.e., starting at the close on September 30th of the mid-term election year – and what does Murphy go and do?  He (She? Hmmm, that might explain a few things) invokes his (her?) dreaded Law and the market gets hammered right out of the box in early October.

Fortunately for me I have made enough mistakes in the market over the years that I don’t even bother to feel stupid anymore when things go exactly the opposite of what I might have anticipated.  This leads me to invoke a maxim I adopted (after a long, painful process) a long time ago:

Jay’s Trading Maxim #412: Murphy hates you.  Plan accordingly.

To put it into other terms, it essential for any trader or investor to give some thought as to  what might go wrong before taking any particular action and to come up with an answer to the following question:

“What is my worst case scenario and what specific action will I take to mitigate the damage should this scenario unfold?”

Sounds like such an obvious question to ask and answer doesn’t it?  But here is another question that will likely make a lot of readers squirm:

“Do you have an answer to the question above?  Every time you make a trade?”

OK granted that’s two questions, but you get my drift.

Where to From Here?

So here is the part of the article where most “highly trained professional market analysts” tell you why the market is almost certain to rise (or fall) from here. Unfortunately, the bad news for me is that I am not very good at predicting the future (plus let’s face it, I can’t risk pissing Murphy off again).  So while it “feels” like the market could melt down at any moment, I have little choice but to simply follow my plan and give the bullish case the benefit of the doubt.  So two things to note:

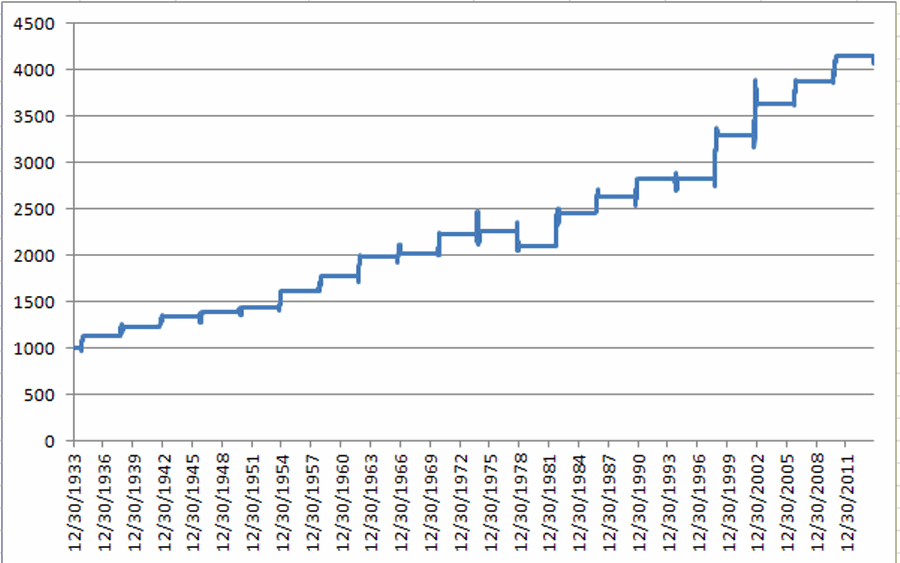
#1. October through December in Mid-Term Election Years

In Figure 1 you can see the growth of $1,000 invested in the Dow Jones Industrials Average only during the months of October, November and December during mid-term election years, starting in 1934 (i.e., 1934, 1938, 1942, etc.)oct-dec midterm 1 Figure 1 – Growth of $1,000 invested in DJIA Oct-Nov-Dec of Mid-Term Election Year (1934-present)

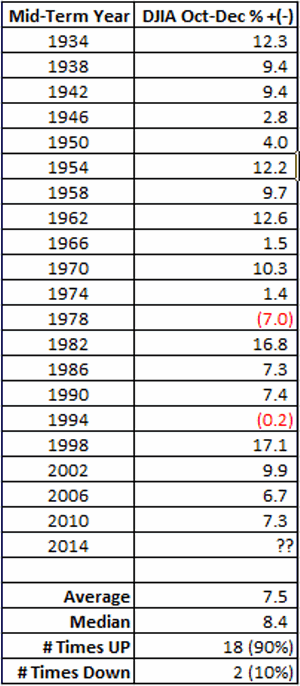
Figure 2 shows the year-by-year results

oct-dec midterm 2

Figure 2 – DJIA performance Oct through Dec of Mid-Term Election Years

As you can see, this period has showed a gain 90% of the time.  Granted a few were pretty miniscule, still the median gain was in excess of 8% and the worst previous performance was -7%.

#2. Short-Term Oversold

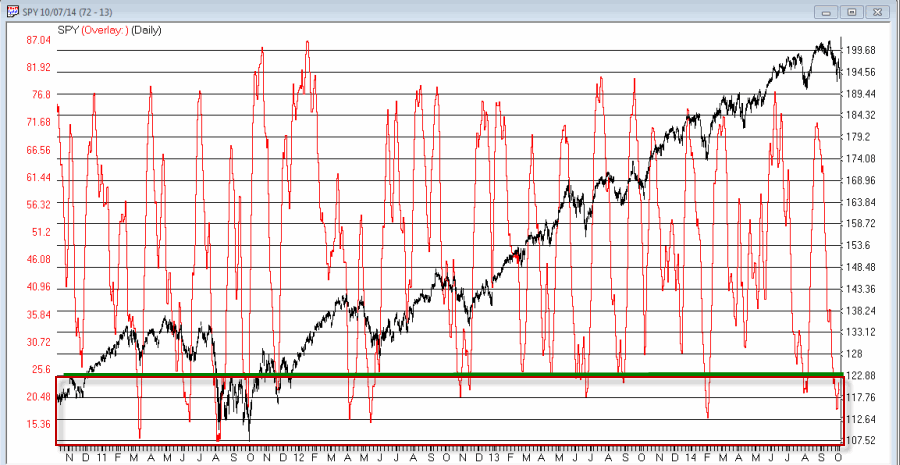
Well I could hardly refer to myself as a highly trained professional market analyst if I didn’t have my own proprietary  overbought/oversold indicator, so, voila, surprise, surprise, my own proprietary overbought/oversold indicator (cleverly named JKOBOS) appears in Figure 3.jkobos Figure 3 – Jay’s Overbought/Oversold Indicator is flashing an oversold (i.e., theoretically bullish) signal at the moment (Chart courtesy of AIQ TradingExpert)

A close look at the chart in Figure 3 reveals that JKOBOS readings below 25 tend to highlight decent buying opportunities.  With the indicator presently standing at 21.8, this qualifies as at least a “bullish alert”.

Summary

So is the combination of a bullish seasonal trend (i.e., October through December of Mid-Term election years) and an oversold market (based on a reading from my own overbought/oversold indicator) telling us that another rally is in the near future? 

The honest answer is “not necessarily”.  The optimistic answer however, is that despite the fear and loathing that seems to permeate the market these day (or maybe partly because of it), there is a chance that the market could surprise to the upside.  As a dutiful trend follower I personally have little choice but to continue to give the bullish case the benefit of the doubt.

Just don’t anyone tell Murphy I said that………sssshhhh!

Jay Kaeppel

Sittin’ by the Stock Market Bay….

…watching the trend roll away.

Once I gain I apologize for the lack of posting activity of late.  It just seemed that there wasn’t much that needed to be said about the seeming perpetual state of affairs:

Step 1. Each day the world descends a little further into chaos

Step 2. The financial markets couldn’t care less (i.e., stocks go up, interest rates remain mostly unchanged and gold goes down)

What else do you need to know?

Despite the fact that I spend a pretty fair amount of time gazing at the world around us and shaking my head I have remained steadfastly in the bullish camp throughout 2014 – despite the fact that my “gut” said it would be a good year to “Sell in May” (Sometimes I wish gut would keep its big mouth shut) – for no other reason than the simple fact that the stock market has remained in a pretty obvious uptrend throughout.  Which reminds me of:

Jay’s Trading Maxim #129: Despite all the information that swirls around us every minute of every day, sometimes, sitting around doing nothing is a pretty good investment strategy.  Ironically, sometimes it’s also the hardest one to follow.

And now we stand on the cusp of what historically has been the most bullish time of the decade (September 30th – Mark Your Calendar).  In regards to the article in that link I recently had an “interesting” discussion on the topic.  It went something like this.  

Other person (heretofore, OP): So I see you are bullish on the stock market for the next 18 months.

Me: Really?

OP: Yeah, I saw your article where you predicted that the stock market would rally sharply during the mid decade months.

Me: Um, that wasn’t really a prediction.

OP: Well, what the hell was it then?

Me: Um, it was mostly a history lesson to alert investors to an interesting historical trend.

OP: So you don’t think it’s gonna work this time?

Me: I don’t know if it will work or not this time around.

OP: Well then what did you bring it up for?

Me: Actually, I didn’t bring it up, you did.

OP: Huh, what?  No you wrote the article – what for?

Me: I thought it was a pretty interesting and persistent historical trend.

OP: Yeah, but if you don’t think it’s gonna work this time around then what’s the point of bringing it up?

Me: I don’t know if it will work or not this time around – and I didn’t bring it up, you did.

OP: Well (frustration building – not to mention alcohol beginning to kick in), what kind of market forecaster are you anyway?

Me: I’m not a market forecaster.

OP: Sure you are, I read your stuff all the time.

Me: God bless you for that sir, but I don’t really try to predict what will happen next.

OP: So you don’t even have the courage of your convictions!?

Me: Well, there’s a very fine line between courage and stupidity…

OP: What’s that supposed to mean?

Me: Precisely.

OP: You wanna step outside pal?

Me: Um, we already are outside…..this is your back yard, remember?

OP: So you don’t know anything about the stock market AND you’re  a smart aleck.

Me: Well……

And so on and so forth.

Which leads us to:

Jay’s Trading Maxim #127b: Sometimes not thinking about and not talking about the financial markets is a pretty good thing to do. Ironically, sometimes it’s also one of the hardest things to do (especially when there is alcohol involved).

Also to:

Jay’s Life Maxim #33: When you are the only sober person in an argument, remember, time is on your side.  Be patient, wait for the inevitable unforced error, quietly declare victory and move away quickly but quietly (or, if all else fails, wait for your opponent to lose consciousness).

So even despite the recent weakness in the stock market – and what my gut tells me is an “obvious” topping formation forming (SHUT…UP!) – anyone who came into 2014 fully invested and has yet to make a trade this year is doing reasonably well (unless of course you were invested in small-cap stocks, but I digress).

For those who can’ fight the urge, sometimes a simple trend-following technique combined with a simple pullback and a simple entry trigger can work pretty well.  For example:

1. 10-day simple MA > 20-day exponential moving average and 20-day exponential moving average above 30-day exponential moving average (this is Dave Landry’s Bowtie Method which I learned from Dave Steckler at http://www.etfroundup.com/)

2. An oversold indicator becomes, well, oversold, what else?  For our purposes we will say that the 3-day RSI drops below 45.

3. The next time a daily high exceeds the previous day’s high by 0.02 points or more, then buy.

In a nutshell:

1. Trend up

2. Pullback within an uptrend

3. Short-term reversal back to the upside

Let’s assume a trader buys when the previous day’s high is exceeded by 0.02 or more following the setup described above.  For simplicity’s sake we will assume that the trade is exited when the 2-day RSI rises above 75.

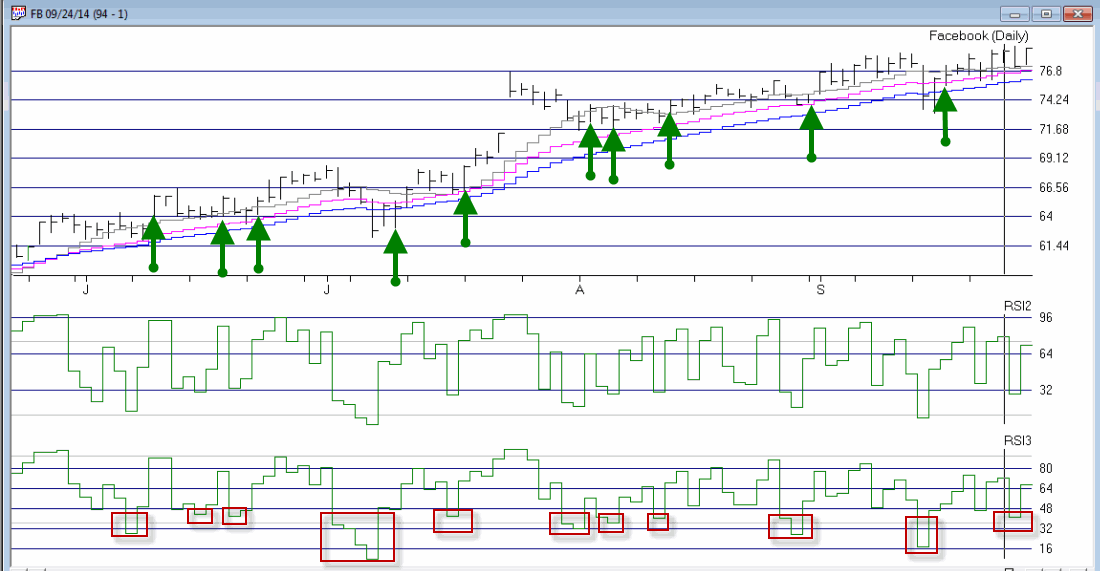
In Figure 1 you see a bar chart for FB with entry signals (i.e., price taking out the previous day’s high following a proper setup) marked with green up arrows.aapl 1Figure 1 – FB in Bowtie Uptrend with an RSI pullback (Courtesy: AIQ TradingExpert)

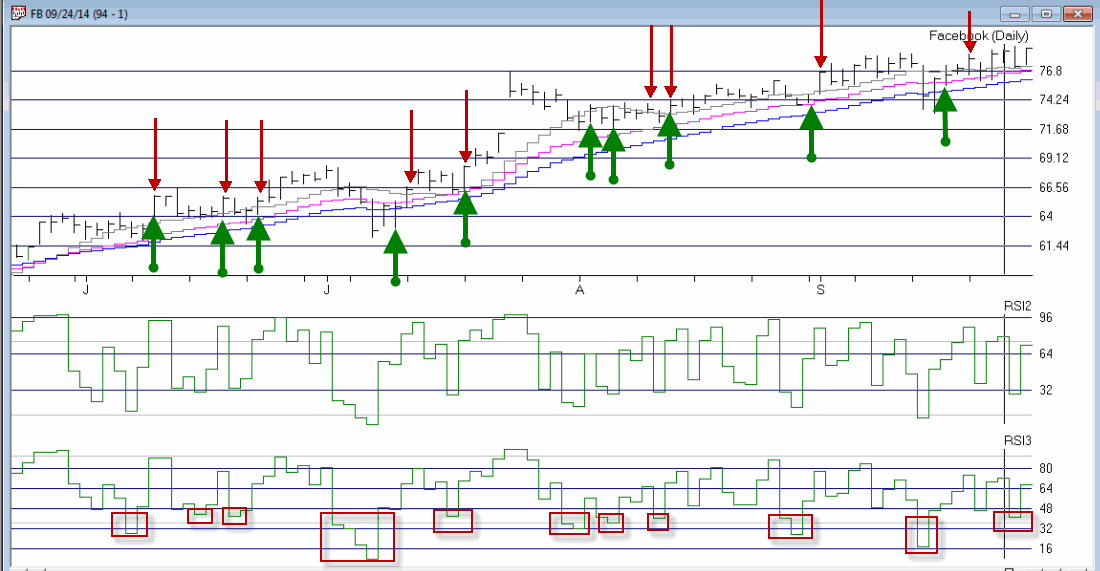
In Figure 2 we see exit signals (i.e., 2-day RSI >= 75) marked in red.  In some cases the entry and exit signal come on the same day. aapl 2Figure 2 – Exit signals for FB in red (Courtesy: AIQ TradingExpert)

This method is not presented as the “be all, end off” of trading.  It is simply an example of one approach for taking small bites out of a longer-term uptrend (for those of you who cannot fight the urge to “do something”).

Summary

Someday the stock market will experience another meaningful decline, interest rates will rise and gold will advance again (no, seriously) in a meaningful way.  Attempting to predict in advance when that day (or days) will come is not a valuable use of anyone’s time.  While traders can take advantage of trends by trading shorter-term – as I’ve just demonstrated – in the immortal words of Paul Newman in “Cool Hand Luke”:

“Sometimes nothing is a real cool hand.”

Jay Kaeppel

Options Related Article in October 2014 Stocks & Commodities Magazine

It’s self serving announcement time here at JayOnTheMarkets.com.  Please see my option trading related article in the October 2014 of Technical Analysis of Stocks & Commodities (www.Traders.com).

The article is titled “Introducing the Open Collar” which details a slight twist on the “collar” strategy, which is mostly used by traders to limit the risk on a stock position for a period of time – while also limiting the upside potential.  The “Open Collar” is an attempt to alter things enough to limit risk on the downside while also retaining unlimited potential on the upside.  If you have ever considered using options to hedge a stock position or portfolio you might find this to be a useful idea (NOTE: in the interest of full disclosure, yes, my opinion is slightly biased in this case).

Jay Kaeppel

Let It Rain…a Little…For Now

Well it’s raining like crazy here in the greater Chicagoland area (which reminds me, have we usurped the title of “Murder Capitol” from Detroit yet?  I digress) and the stock market is – of all things – kind of going down of late.  Who knew that that was still possible?  Of course the truth is that we can probably use both – the rain and a “pullback” in the market, that is (the Murder Capitol thing, maybe not so much).

I have been on something of a hiatus.  Have gotten some nice comments of late from people who used to read my stuff at Optionetics and just discovered my blog.  I appreciate the kind words.  It kind of makes me wish I could think of something useful and/or intelligent to say about the markets.  Around late August I simply fell into the “stocks go up, bonds go up, gold goes down, period, end of discussion” zombie-like line of thinking, and couldn’t really find anything new to say regarding those particular trends.  Sort of a “Lack of a need to do any analysis paralysis.”

September and After

The most bullish portion of the Decade cycle – i.e., the Mid-Decade Rally – starts at the close of trading on September 30th.  Rather than regurgitate all of the relevant numbers I will simply encourage you to review this article (September 30th – Mark Your Calendar!) to get an idea of how the stock market has tended to move during the 18 months smack dab in the middle of the decade (Hint: “Up”).                 

In the meantime, a pull back in the stock market during the month of September might be “healthy” in the long run.  Of course, we can also file this idea under the category of “Be careful what you wish for.”  On a certain level it sounds logical to say “hey if the stock market experiences a nice, neat 3-5% pullback during September it may very well set the stage for the net leg up.”  Unfortunately I have on several occasions in the past seen this type of thinking turn into “hey don’t worry, this current pullback is just setting the stage for…………AAAAAAAAAAAAAAAAHHHHHHHHHHHHHHH!!!!!!!

So like I said, probably best to take it as it comes for now….and be careful what we wish for.   I promise to start posting a little more regularly soon.

Jay Kaeppel


War, Genocide, Riots: Markets Say ‘Ho Hum’

Well I haven’t been posting much lately, but what’s new to say really?  This is getting really boring.  The financial markets I mean.  Oh sure, there’s no end to the apparent chaos going on around us – Wars, genocides, beheadings, riots, and so forth.  But the markets haven’t changed their tune one bit.

Stock market up, Bond market up, gold market down.  Repeat.

So despite all of the turmoil, 2014 is shaping up as one of the boring years in history for the financial markets.  Outside of the financial markets, American citizens are told to do exactly what we have been told to do since 9/11 – “just keep shopping.”   And the 50% or so of citizens who are not receiving government check s are trying their best.  Actually, the other 50% haven’t stopped shopping yet either.

While there are hints of seething rage and restlessness out there, in a nutshell “Hope and Change” has mostly morphed into “Mope and Complain” as “Jobs American Won’t Do” has morphed into a “new normal” of “Jobs Americans Can’t Find.”

But who are we investors to complain, what with the stock market and the bond market marching relentlessly to ever higher new highs?  For the record, I am predicting that the stock market will take a hit in the month of September (“Har, good one, Jay”).  Of course, for the record I also suggested that this would be a good year to “Sell in May.”  Of course – also for the record – I haven’t sold a thing (I am speaking here of investments, not short term trades).  The old trend-follower in me keeps whacking the side of my head and asking “what are you thinking about?”

For the record, you don’t want to know.

In the Meantime

While waiting for something to break the mind numbing doldrums presently unfolding in the markets, the focus is on shorter-term trading opportunities.  In recent articles (http://tinyurl.com/mzhstm2) and (http://tinyurl.com/p4ve6z8) I talked about a simple method for attempting to play short-term bearish situations.  Similar things can be done on the bullish side.

One simple method for finding potential opportunities involves:

1. Stock or ETF trading above 200-day moving average

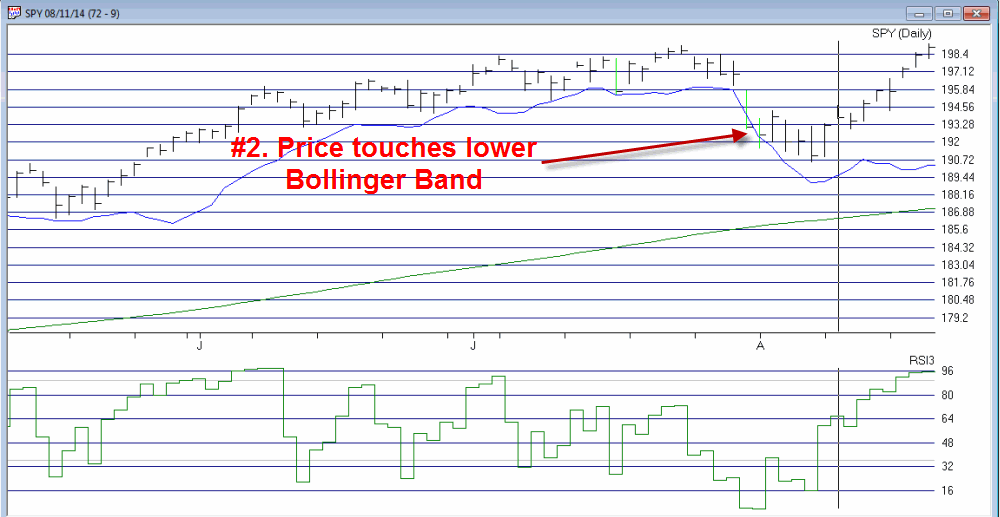
2. Stock low price touches lower Bollinger Band (using moving average of 10 and multiplier of 2)

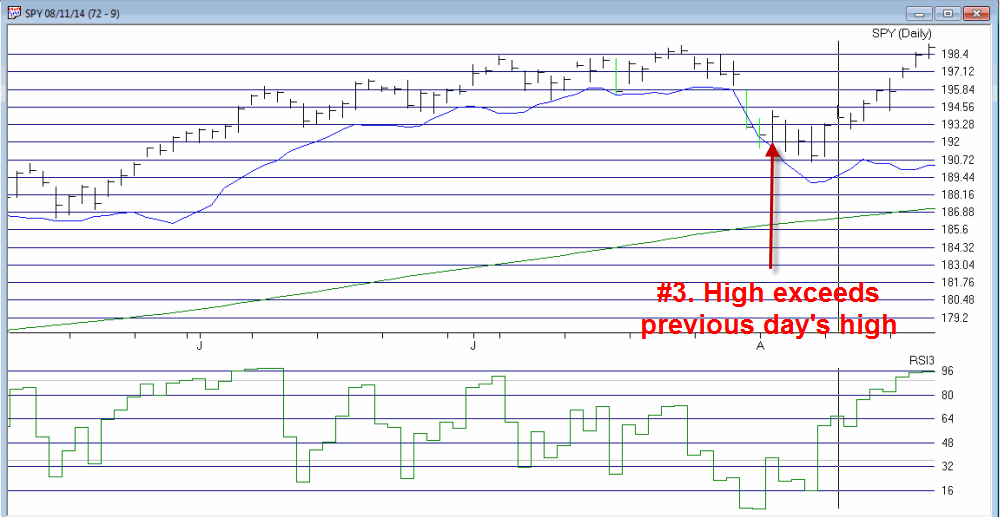
3. Stock subsequently exceeds high from previous trading day

4. At least a 1-day bullish divergence forms using the 3-day RSI

OK, that sounds like a lot to digest, so let’s break it down a little bit.spy 821 1Figure 1 – SPY trading above 200-day moving average (Courtesy: AIQ TradingExpert) spy 821 2Figure 2 – SPY low price touches lower Bollinger Band (Courtesy: AIQ TradingExpert)spy 821 3 Figure 3 – SPY high exceeds previous day’s high (Courtesy: AIQ TradingExpert) spy 821 4Figure 4 – Bullish divergence using 3-day RSI (Courtesy: AIQ TradingExpert)

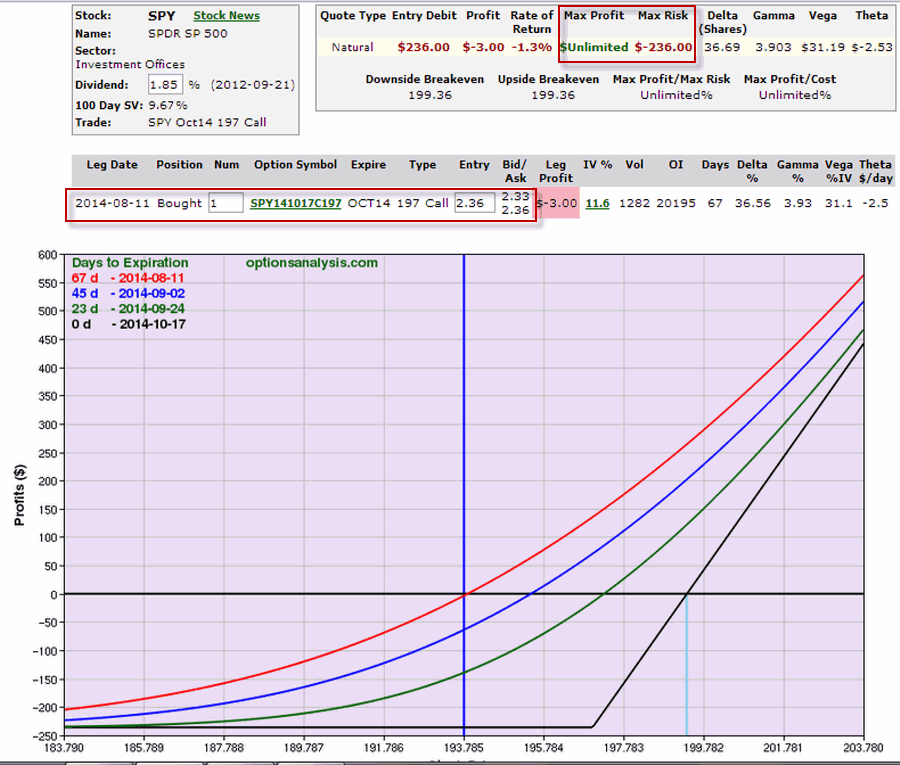
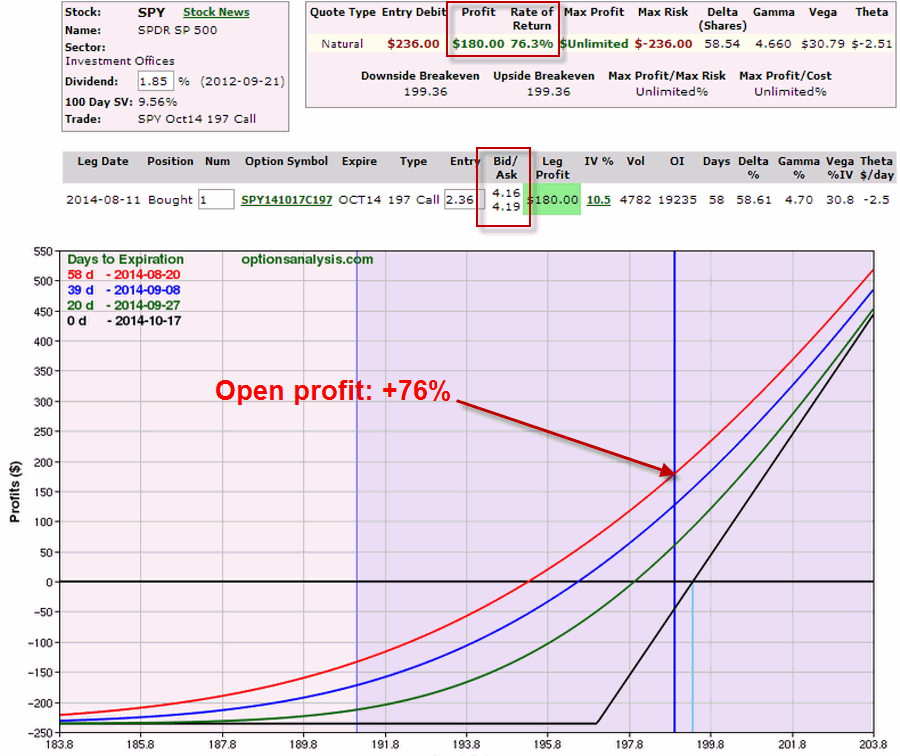
On 8/11 a trader might have considered buying a call option on SPY as a low dollar risk speculation on a bounce in price.

Using the “Percent to Double” routine at www.Optionsanalysis.com yields the following possibility.spy 821 trade 1 Figure 5 – Long SPY Oct 197 Call (Courtesy: www.Optionsanalysis.com)spy 821 trade 2Figure 6 – Long SPY Oct 197 Call as of 8/21 (Courtesy: www.Optionsanalysis.com)

Summary

The seeming disconnect between the goings on in our little world versus the actions of the financial markets is at a level that I personally cannot recall.  When something happens that you have not experienced before there is a tendency to want to “do something” – usually something very out of the ordinary – in response.  But history shows that for investors and traders, developing and adhering to a well thought out trading plan – and not twisting and turning in reaction to every outside event – is the real key to long term trading success.

Which reminds me of:

Jay’s Trading Maxim #3:  If you are going to develop an investment plan, you might as well make it a good one. And if you have a good trading plan, you might as well go ahead and follow it.

Jay Kaeppel


The RSI 3 Strikes and You’re Out Play (Part II)

In my last article (http://tinyurl.com/mzhstm2) I wrote about a simple entry method I have dubbed “The RSI 3 Strikes and You’re Out Play” or TSYO, for short.

The RSI 3 Strikes and You’re Out Method is a good candidate for option traders as it offers the potential to “make a few bucks” when the market experiences a pullback.  So this week I want to offer a few examples.

In the interest of full disclosure I had planned to do it last week, but once my family and I arrived in Aruba I quickly settled into the “Sleep Late, Run on the Beach, Lay on the Beach, Swim in the Ocean and the Pool, Shower, Go to Dinner, Repeat” routine.  And in the midst of that “busy” schedule I found little time to write.

TSYO Examples

I have a list of stocks and ETFs that I follow for option trading purposes.  Not necessarily the “definitive” list but a good mix of tickers that trade lots of option volume.  The list in Figure 1 displays some recent TSYO signals for some of the stocks on my list. 

*The first column shows the stock ticker. 

*The second column shows the date of the “Alert” signal (i.e., the 2nd non confirmation by RSI). 

*The third column shows the date that the stock or ETF takes out the low of the previous three days. 


Ticker

Alert

3-Day Low

AMGN

7/3

7/8

AMZN

7/22

7/25

EEM

7/28

7/30

F

7/24

7/25

GM

7/3

7/17

IBM

7/18

7/21

IBM

7/24

7/30

IWM

7/1

7/7

JPM

7/28

7/29

SLV

7/2

7/7

SMH

7/22

7/24

TXN

7/11

7/17

Figure 1 – TSYO Alerts and Triggers

For the purposes of this article we will assume that a put option is bought at the close of the “3-Day Low” day.  For deciding which put option to buy we will use the “Percent to Double” routine found at www.Optionsanlysis.com.

One note, while I will highlight the profit potential for each trade reviewed, I will not detail any specific “exit criteria”.  My goal is to highlight the entry signal and not necessarily create a mechanical “system”.  I also think that each trader should do some thinking and consider their own criteria for when to take a profit or cut a loss.

Ticker AMGN

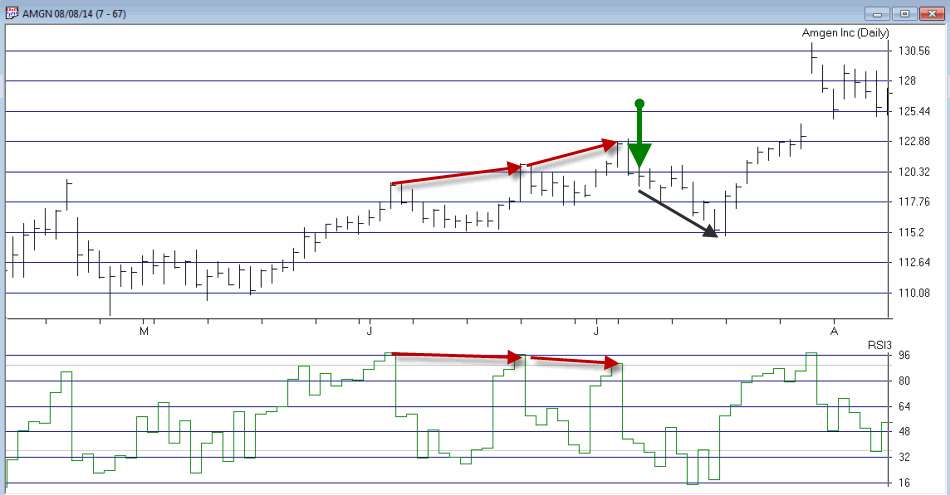
As you can see in Figures 1 and 2, AMGN triggered an “Alert” on 7/3 and made a new 3-day low on 7/8.amgn tsyo bc Figure 2 – AMGN (Courtesy: AIQ TradingExpert)

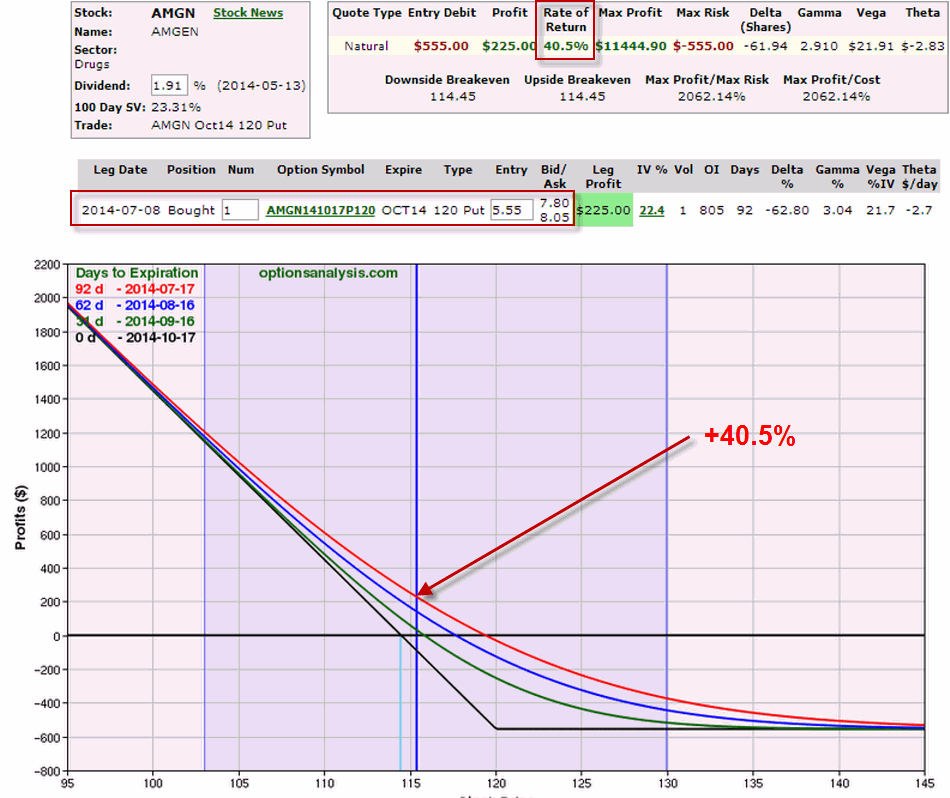
What followed was little more than a modest short-term pullback.  Still, as you can see in Figure 3, if a trader bought the October 120 put option on 7/8, by 7/17 he or she would have had an open profit of +40.5%. amgn tsyo

Figure 3 – AMGN Sep Oct 120 put option (Courtesy: www.OptionsAnalysis.com)

Ticker AMZN

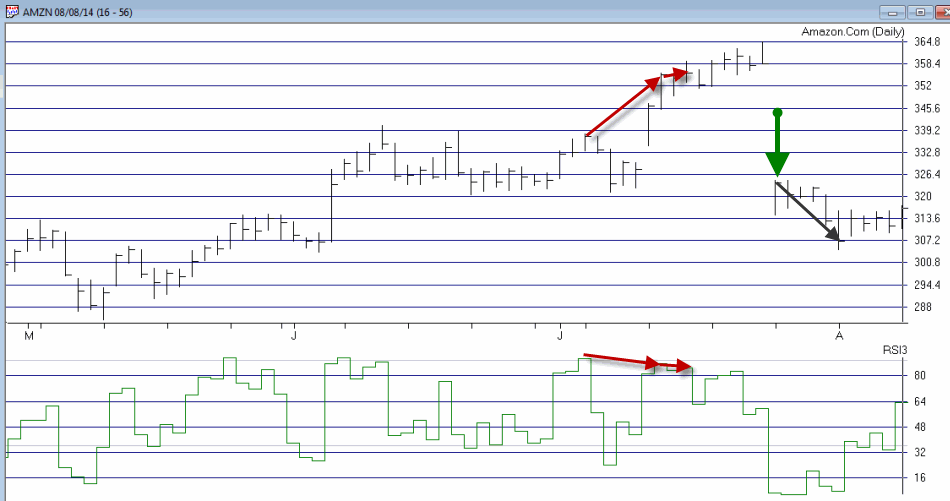
In this example waiting for a 3-day low before entering actually worked against a trader because on 7/25 AMZN gapped significantly lower as you can see in Figure 4.amzntsyo bc Figure 4 – AMZN (Courtesy: AIQ TradingExpert)

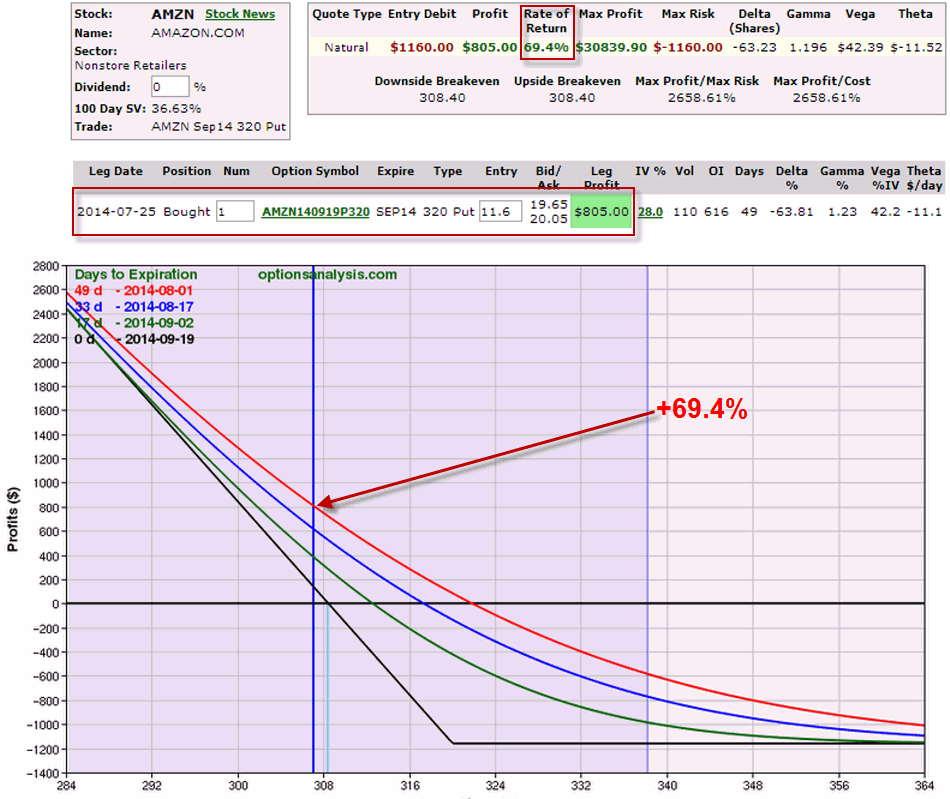
Nevertheless, if a trader had bought the September 320 put option at the close on 7/25, by 8/1 he or she would have had an open profit of +69.4%.

amzn tsyo

Figure 5 – AMZN September 320 put option (Courtesy: www.OptionsAnalysis.com)

Ticker F

The example that follows for Ford (ticker F) highlights two things:

1. The ability to essentially “bet” on a short-term pullback while risking a relatively small amount of capital

2. The above average profit potential associated with trading options.

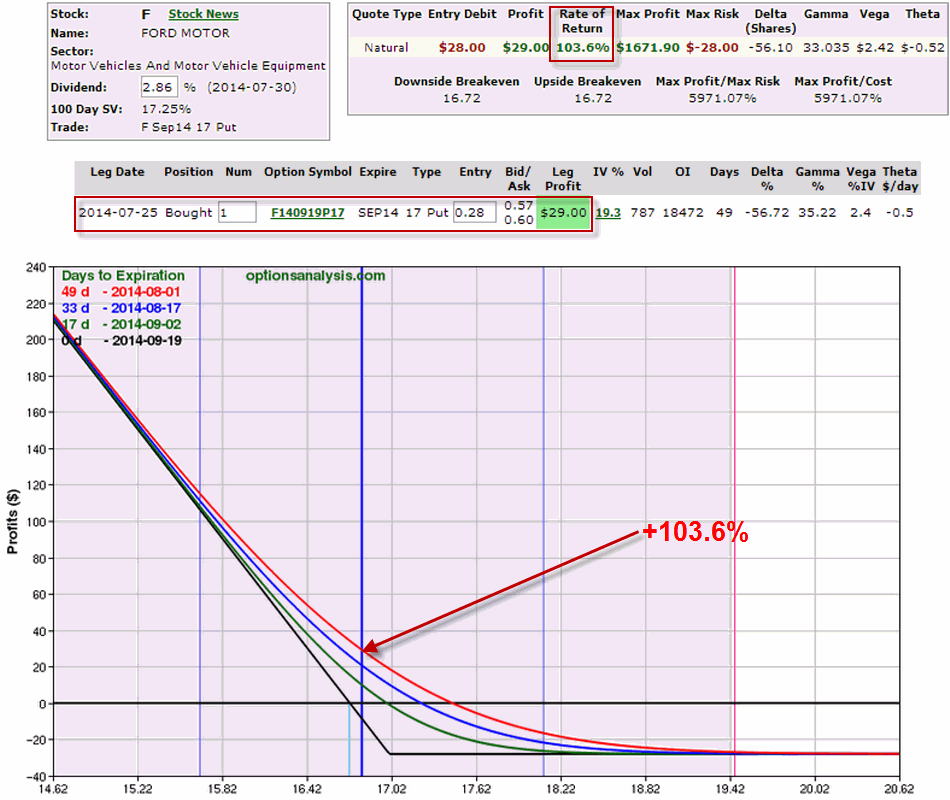
Ticker F triggered an “Alert” on 7/24 and made a new 3-day low on 7/25.f tysobcFigure 6 – F (Courtesy: AIQ TradingExpert)

If a trader had bought the September 17 put option at the close on 7/25, by 8/1 he or she would have had an open profit of +103.6%.f tsyo Figure 7 – F September 17 put option (Courtesy: www.OptionsAnalysis.com)

Summary

So once again, the point of all of this is not to attempt to promote the “be all, end all” of trading.  Because the TSYO method is most certainly not that.  But it can do a pretty decent job of identifying opportunities (especially after the overall market has experienced an extended run up and may be running out of team near term).  For traders who are willing to consider alternative (though simple) strategies such as buying put options, a method such as this can offer the potential to make money even as the overall market pulls back.

No one should go out and start making trades using the method I have detailed here without doing some further study/analysis/etc.  But the real point of all of this is that it is possible to use relatively simple ideas and relatively little capital to achieve trading success.

Jay Kaeppel

The RSI 3 Strikes and You’re Out Play

Please note the use of the word “Play” in the title.  Note also that it does NOT say “System” or “Method”, nor does it include anywhere the words “you”, “can’t” or “lose.”  So what is the distinction in all of this?

The use of the word “Play” is meant to denote that this should not be considered an “investment strategy”, nor even as a “trading method”.  In all candor it should basically be considered as a potential trigger or alert for traders who are willing to speculate in the market.  A few relevant notes:

1. Contrary to what many will tell you, there is nothing wrong with “speculating” in the financial markets.  There is a lot of money that can be made by doing so.

2. The key is in limiting the amount – and/or percentage – of capital allocated to each such trade.

3. Call and put options offer a great way to engage in this type of trading, because by their nature they allow you to “play” while using only limited sums of money.

Think about it this way.  Let’s say you “get a hankerin” to take a flyer on say a rally in the bond market.  Sure you could go out and buy t-bond futures contracts.  As I write they are presently trading north of 138.  At $1,000 a point, that means that the contract value is roughly $138,000.  You only need to put up margin money of about $3,000 in order to enter the trade.  Of course, if t-bonds decline from 138 to 135 then you have lost $3,000.  Good times, good times.

As an alternative you might have bought a call option on the ETF ticker TLT, which tracks the long-term bond.  As I write TLT is trading at $115.51, so to buy 100 shares would cost $11,551.  However, a trader looking to “play” could buy say a September 115 call option for all of $182.  If TLT rallied to say $118 by September expiration the 115 call would be worth $300, which would represent roughly a 65% gain.  And just as importantly, on the flip side, if TLT falls apart the most the option trader could lose would be $182.  Which reminds me of:

Jay’s Trading Maxim #312: If losing $182 on a trade is too much for you to bear – or will cause you great angst or to lose sleep or to beat yourself up – the “trading thing” might not be for you.

The RSI Three Strikes and You’re Out Play

So we will use the 3-day RSI indicator as a trigger to alert of a potential top.  Note the use of the phrase “potential top.”  Note also that nowhere do the words, “pinpoint”, “market” or “timing” appear.  So here is how it works:

1. (Day x) Price and 3-day RSI make a new high for a given move.

2. (Day y) After at least one intervening down day, price makes a higher close than on Day x BUT 3-day RSI stands below its level on Day x.

3. (Day z) After at least one intervening down day, price makes a higher close than on Day y, BUT 3-day RSI stands below its level on Day y.

4. After Day z the entry trigger occurs the next time price drops below the 3 day low.

To put it another way, after Day x price makes to higher closing peaks (with at least one down day between these peaks), while RSI on Day y is below RSI on Day x and RSI on Day z is below RSI on Day y.  OK, that’s as clear as mud.  So let’s go the “a picture is worth 1,000 words” route.

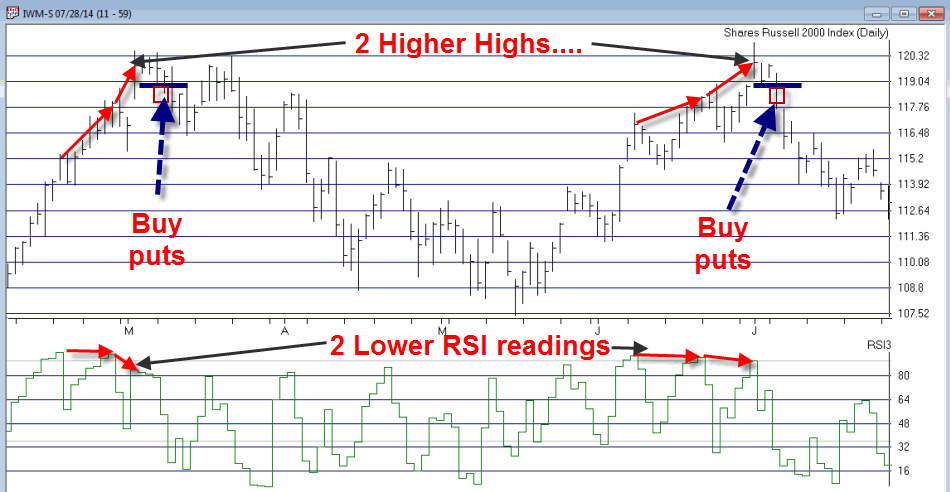
In Figure 1 you can see two examples of this “play” using ticker IWM, the ETF that tracks the Russell 2000 small cap index.  iwm rsi3Figure 1 – The RSI 3 Strikes and You’re Out Play using IWM (Source: AIQ TradingExpert)

In both cases the same scenario plays out.  Price makes two subsequent higher highs while RSI registers two subsequent lower highs.  The signal to buy put options comes when price takes out the three day low.

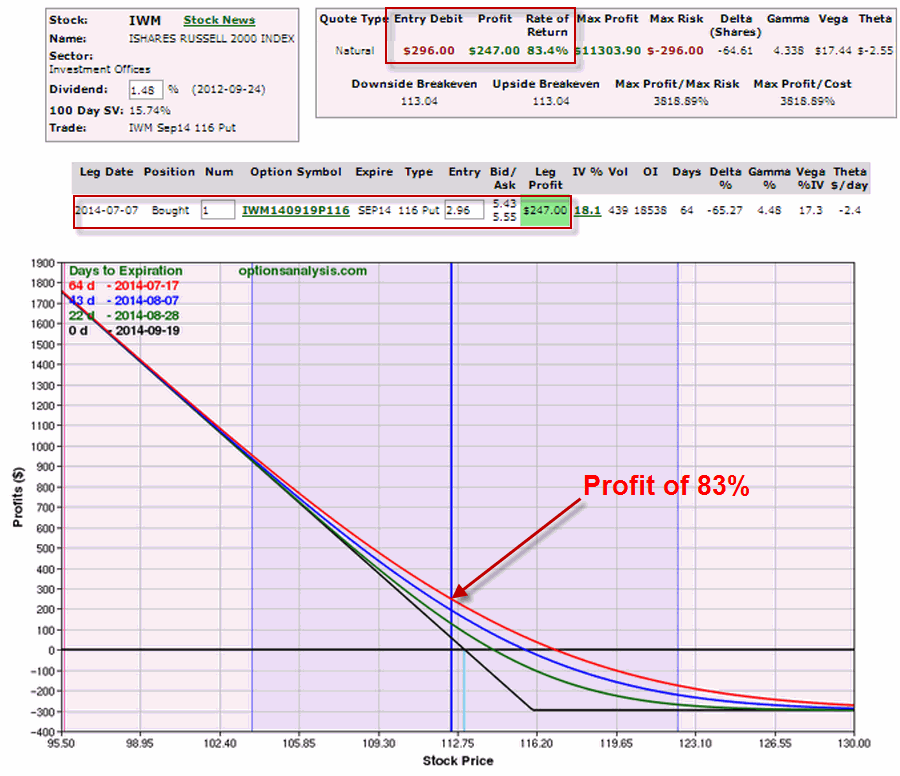
In the second example a trader could have bought a September 116 IWM put for $2.96 (or $296).  Eight trading days later that put was trading at $5.43 for a profit of $83%. iwm outFigure 2 – IWM put option using the RSI 3 Strikes and You’re Out play on IWM (Courtesy: www.OptionsAnalysis.com)

Summary

No one should get the idea that this simple “play” is the “be all, end all” of trading.  I specifically have not included any ideas on when to exit this type of trade so that no one gets the idea of trying to use this as a mechanical trading system.  Some traders may use a profit target, some may use an indicator, some may adjust the trade or take partial profits if a certain level of profit is reached, etc.

Like virtually any other trading idea, sometimes things will work out as hoped and sometimes they won’t.  The bigger lesson is that it is OK to speculate in the markets provided you do not expose yourself to large risks.  Which seems like good time to invoke:

Jay’s Trading Maxim #1: Your most important job as a trader is to make sure you are able to come back and be a trader again tomorrow.

Jay Kaeppel

Check the Dow on August 1st

Wow, that sounds pretty ominous and self important doesn’t it? (Hey, I gotta get people to click on the headline somehow!)

I will keep this short.  As I have been saying for some time, in my own mind I am scared to death that the market is getting far too overbought, the investing public is getting far too complacent, and the supposed “professionals” are getting far too bullish.  And for my own reasons I keep expecting something bad to happen between now and the end of September (followed by something good).

But despite all of this, I still haven’t sold a thing, for the simple reason that I am primarily just a dutiful trend-follower and the stock market just keeps moving relentlessly higher.  So who am I to say that the party is over?

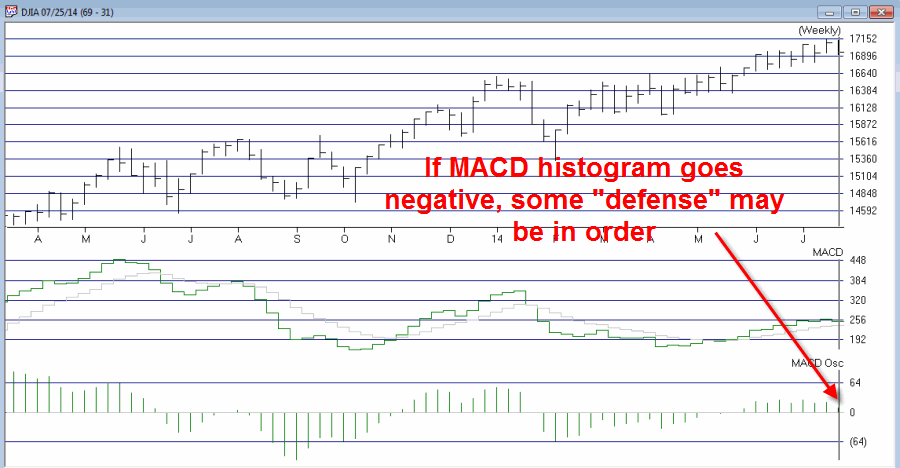
But I am keeping a close eye on the weekly MACD for the Dow Jones Industrials Average.  Rather than going into a detailed explanation regarding “why” I will simply encourage you to review the material in this article – A Warning Sign to Watch.  (Hey, I did say I was going to keep it short, remember?).

In any event if and when the Weekly MACD for the Dow drops to negative territory, a more defensive stance may be in order.

djia macd


Figure 1 – Keeping an eye on Dow Weekly MACD (Courtesy: AIQ TradingExpert)

Jay Kaeppel

A Simple, Aggressive Approach to Large-Cap versus Small-Cap

Certain “arguments” just seem to last.  Since I started in this business (As best as I can recall, stock prices were reported on an abacus at the time) there has always been someone willing to pursue the “large cap versus small cap” and/or “growth stocks versus value stocks” argument.  Early in my career “everyone knew” that “in the long run” (usually defined – incorrectly – as the most recent 2-5 years) small cap stocks “outperform” large cap stocks.

Is this actually true?  The answer is “Yes, but only sometimes.”  The same answer holds true or growth versus value.  In short, no matter what you hear (at least in my humble opinion) there is no compelling evidence that large-cap stocks inherently perform better or worse than small-cap stocks nor that growth stocks perform better or worse than value stocks.  That’s the bad news.

The good news is that the interplay between large-cap and small-cap (and growth versus value) fluctuates – or more accurately, trends – over time.  In other words, it is not uncommon for large-cap stocks to outperform for awhile and then for small-cap stocks to outperform for a good long while.  If one can identify a trend then an opportunity exists.

One Simple, Albeit Aggressive Way to Play

The method I am about to describe is really pretty simple, however, it does involve risk as the method uses a leveraged mutual fund.  As a preface, the “safe” news is that this method is in the market only about 44% of the time (and is safely tucked away in cash the other 56% of the time). The “dangerous” news is that when it is in the market it is in a leveraged mutual fund that tracks large-cap stocks.  So, bottom line: it is not necessarily for the faint of heart.  More to the point though, it may be ultimately be useful to traders who are willing to invest a certain percentage of their capital in more “volatile” investments in hopes of an above average longer-term return.

So here are the steps:

A = Closing price for ticker RUI (Russell large-cap)

B = Closing price for ticker RUT (Russell small-cap)

C = 252-day % Rate of change for ticker RUI ((A / A 252 trading days ago)-1)*100

D = 252-day % Rate of change for ticker RUT ((B / B 252 trading days ago)-1)*100

E = (C – D)

If E > 0 this indicates that large-cap stocks have outperformed over the previous 252 days, and vice versa.

Trading Rules

If E > 0 today then buy ticker ULPIX (Profunds UltraBull) tomorrow and hold until E < 0.

If E < 0 today then sell ticker ULPIX and hold cash until E > 0

OK, not exactly “sophisticated”, still as a proud graduate of “The School of Whatever Works” (all hail good old “SWW”), I am far less interested in “process” as I am “results”. Which leads us directly to:

The Results

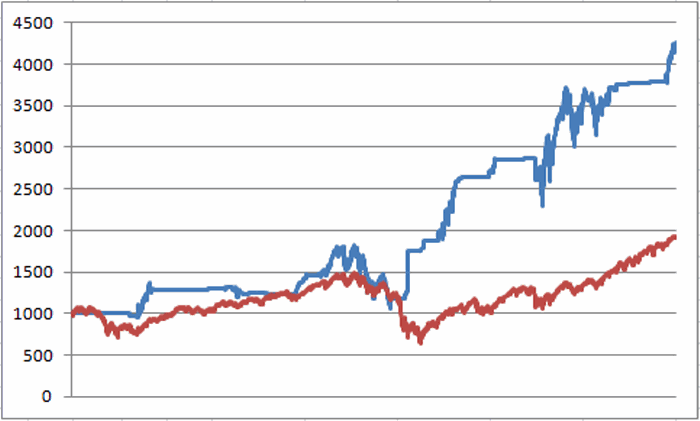
The test I ran started on 10/15/2001 when ticker ULPIX first began to trade.  The equity curves for the method described above versus buying and holding ticker RUI appear in Figure 1. jotm2014-0724-01Figure 1 – Growth of $1,000 using Jay’s ULPIX Method (blue line) versus buying and holding ticker RUI (red line); 10/15/01 through 7/23/14.

In a nutshell, $1,000 invested using the system grew to $4,257 versus $1,932 using a buy-and-hold approach.  The year-by-year results appear in Figure 2.

Year

System

RUI

2002

1.0

(22.9)

2003

26.6

27.5

2004

2.0

9.5

2005

(9.3)

4.4

2006

23.7

13.3

2007

8.0

3.9

2008

10.3

(39.0)

2009

49.7

25.5

2010

8.9

13.9

2011

6.8

(0.5)

2012

15.1

13.8

2013

8.0

30.6

2014

12.5

7.4

Average

13.0

4.5

Std Dev

15.8

19.8

A/SD

0.821

0.226

Figure 2 – Annual Results; Jay’s ULPIX System versus Buy-and-Hold

As you can see in Figure 2, since 2002 the system has averaged 13% annually versus just +4.5% for buy and hold.  It should also be noted that the standard deviation of annual returns was lower for the system.

On the downside investors should be sure to note that despite the fact that the “system” showed a gain for 2008, it nevertheless experienced a -42% drawdown during 2008. So just, repeating now, this method cannot be characterized as “low risk” in any way shape or form.

It is also worth noting that the annual system results versus buy and hold is all over the place.  So anyone looking for an endless string of “out performance” year after year, will definitely need to look elsewhere.  The proper perspective is this: when the system is in the market it occasionally makes a lot of money.  When it is out of the market it doesn’t make much at all – even if the stock market overall is rising.

For the record the system has been in ULPIX since the close on 5/7/14 and shows no immediate signs of getting out.  As of 7/23/14, RUI is up 17.8% and RUT is up 10.1% over the latest 252 days.  So “Value E” from above is +7.7%.  The system will continue to hold ULPIX (for better or worse) until Value E once again falls into negative territory.

Summary

As always, I am not recommending that anyone rush out today and jump into large-cap stocks just because the method I have described is presently bullish.  Nor am I even suggesting that anyone should adopt this system.  Before anyone engages in any type of trading that involves the use of a leveraged mutual fund, there are a few introspective questions to be asked and answered regarding one’s own tolerance for risk, what type of asset allocation is reasonable, and whether The School of Whatever Works offer classes online? (OK, just kidding about the last one).

The real point of this piece is twofold:

1) To dismiss the notion that large cap stocks are inherently a better investment than small-cap stock, or vice versa and;

2) To illustrate that with a little bit of analysis and effort it may be possible to come up with simple methods that take advantage of trends in the marketplace.

Now if you’ll excuse me, I have to get back to class.

Jay Kaeppel