All posts by admin

Jay’s Trading Maxim’s (Part 1)

Just dug these up from “Kaeppel’s Corner” articles I wrote for www.Optionetics.com for 9 years.  Turns out  there is a bunch so I am going to spread them out a bit.  Anyway:

Jay’s Trading Maxim #1: Your absolute #1 priority as a trader is to be able to come back and be a trader again tomorrow.

Sounds so obvious, doesn’t it?  But you would be surprised how many people violate this maxim.  And it’s a hideous thing when it happens.

(See also Jay’s Trading Maxim’s (Part 2) and Jay’s Trading Maxim’s (Part 3))

Jay’s Trading Maxim #2: The keys to trading and investment success are, A) utilizing a method or methods that have a realistic expectation of generating profits over the long run, and B) having the financial and emotional wherewithal to follow your method(s).

(A or B alone is not good enough.  If you have a lousy trading plan then the worst thing you can do is to actually follow it.  Likewise if you have a great trading plan but can’t quite seem to follow it, well, let’s just say that that’s not going to end well either.)

(See also One Way to Play a Spike in SPY Volatility)

Jay’s Trading Maxim #3: Basically everything that you do as a trader or investor should serve to make sure that you are adhering to 2A and 2B above.

 Jay’s Trading Maxim #4: The volatility of the fluctuations of the equity in your account will have a greater impact on your success or failure as a trader than any other factor.

Swing too little and you never quite make enough on the “ups” to offset the “downs”; swing too much and eventually (and Murphy’s Law being what it is, at exactly the wrong time) you cry “Uncle” and one day you find that you are not a trader anymore.

 Jay’s Trading Maxim #7: Rocket science is great but when it comes to investing, it’s not necessarily necessary.

 Jay Trading Maxim #9: The fact of the matter is that there are lots of trading methods that work well.  The trick is finding one that works well for you.

 Jay Trading Maxim #12: All of trading comes down to (# of winners/# of losers) times (Average winning trade / Average losing trade).  Higher values equal greater success, lower numbers….not so much.

 Jay’s Trading Maxim #14: When push comes to shove in the financial markets (and come to think of it, life in general), you alone are responsible for your own actions.  So choose wisely.

 Jay’s Trading Maxim #20: The markets don’t always do what you want them to do.

This leads us directly to:

Jay’s Trading Maxim #21: How right or wrong you are on a given idea matters not a wit.  The only thing that really matters is how much money you actually make or lose in the process.

Jay’s Trading Maxim #22: If a setup “looks too good to be true” (but might still turn out to be true anyway), consider a limited dollar risk trade using options.

Jay’s Trading Maxim #24: The danger of a winning trade is the potential for it to fill your head with visions of grandeur.

Jay’s Trading Maxim #25: The danger of an unmanaged losing trade is obvious – you can lose your shirt.  The other insidious danger of any losing trade is that it can affect your thinking and make you second guess subsequent decisions for a very long time.

Jay’s Trading Maxim #26: The day that you experience absolutely no emotion as you are stopped out of a properly managed losing trade is the day you gain the potential to become wildly successful in the markets.

Jay’s Trading Maxim #27: When it comes to trading/investing, between theory and reality there is a chasm a mile wide.

A more succinct corollary is:

Jay’s Trading Maxim #28: If you don’t consistently cover your a?# then eventually you will lose you’re a?#.

In other words, it’s good to have an idea to use as a basis or foundation for investing.  But you absolutely, positively must make the assumption that sooner or later something unexpectedly bad will happen.  And if you do not take steps to be prepared in advance to deal with that adverse event, well, please review Trading Maxim #28 above.

Jay’s Trading Maxim #29a: One of the most surefire ways to lose money in the financial markets is to trade a futures contract without a thorough understanding and appreciation of the potential risks involved.

Jay’s Trading Maxim #29b: The worst thing that can happen to any trader is that they recklessly violate JTM #29a and somehow make money on their first three futures trades anyway (i.e., once you think you’ve “Got The Touch”, you “Are Toast”).

Jay’s Trading Maxim #31: Never stick your head fully into the sand – it’s really hard to breathe.

And

Jay’s Trading Maxim #32: He who “bets the ranch” (figuratively speaking), ends up “finding another line of work in a non agricultural field” (also figuratively speaking).

Jay’s Trading Maxim #37: Recognizing the trend right now is worth far more than a thousand predictions on what will happen next.

Jay’s Trading Maxim #44: At no time are money management and risk management more imperative than when everything looks like it’s all about to come up roses.  Or to put it more succinctly, you are at your greatest risk when your defenses are down.

Jay’s Trading Maxim #50: The markets don’t always do what you want them to do.  Likewise, the markets don’t always do what you expect them to do.  If you accept these facts and plan accordingly, you may or may not trade more profitably, but you’ll definitely experience a lot less “angst.”

Jay’s Trading Maxim #71: It’s really hard to predict what’s going to happen in the stock market over the next [your time frame here].  And when I say “really hard” I mean “really, really hard”.

This maxim evolved from a recurring and disturbing pattern of events that basically went something like this:

1) One guy would predict that the market would go up over the next x-months.  And in fact it actually would.

2) Suddenly everyone – myself included – couldn’t wait to hear what this “oracle” had to say next.

3) Maybe he would get another call right, but eventually he would get it almost exactly and completely wrong – either confidently advising everyone to “buy” just before a big market drop, or shouting “SELL” right before – you guessed it – the next big rally.

4) Then everyone would scurry off to follow another advisor who had correctly “predicted” the rally that the last guy had missed.

5) So on and so forth, repeat, ad nauseum, ad infinitum.

Jay Kaeppel

One Way to Play a Spike in SPY Volatility

We live in interesting times.  At the moment things are “so interesting” that the traditional long-term investing approach to, well, investing is not faring so well.  Fortunately – and seemingly unbeknownst to far too many individuals – there are alternatives to simply sitting there and “taking it.”

This is a tale of one of those ways.  Not necessarily the “best” way mind you.  And certainly not the only way.  But, hey, its “one way.”

Bull Put Spread in SPY

A “bull put spread” is an option trading strategy that essentially makes money as long as the security in question remains above a certain price.  In other words, it does not necessarily require a bullish move in the underlying security for the trade to profit.  Anything besides the underlying security falling apart will typically suffice.

There are a few key ingredients that a trader should look for before utilizing this strategy:

*Some reason to believe that the underlying security will remain above the breakeven price long enough for the trade to make money (this typically involves either an obvious support level, a particular chart pattern and/or some confirmation from one or more technical indicators that price will stabilize or move higher).

*High implied option volatility (because a bull put spread involves “selling premium” and has limited profit potential, it is important to sell as much premium as possible.  High implied volatility tells us that there is a lot of time premium built into the price of the options).

The Setup in SPY

In Figure 1 we see a bar chart for ticker SPY – the ETF that tracks the price of the S&P 500 Index.1Figure 1 – SPY with Support level and Oversold reading (Courtesy AIQ TradingExpert)

As you can see:

*There is a clear “line in the sand” support level not too far below the recent price level. Does this guarantee that the recent decline will end there?  Not at all.  But it does provide us with a price level which – if pierced – can serve as a natural stop-loss point.  And prices do have a way of bouncing off of major support levels (sometimes?).

*Also, SPY is oversold according to the custom indicator that I created that is highlighted (and which I wrote about here; see Measure #2).  Does this guarantee a bounce?  Again, not at all.  But the indicator in question does show a decent propensity to identify at least short-term turning points for SPY.

In Figure 2 we see that implied volatility for SPY options has “spiked” back up to a relatively high level.  Again, this implies that there is an above average level of time premium built into the price of SPY options.2Figure 2 – SPY with high IV (Courtesy www.OptionsAnalysis.com)

Bull Put Spread

As always, what follows is an “example” and not a “recommendation”. But the example trade highlighted involves:

*Selling 6 Feb Week 4 SPY 178 puts @ 1.62

*Buying 6 Feb Week 4 SPY 173 puts @ 0.86

The particulars appear in Figure 3 and the risk curves appear in Figure 4.

3Figure 3 – SPY Bull put spread (Courtesy www.OptionsAnalysis.com)4Figure 4 – SPY Bull put spread risk curves (Courtesy www.OptionsAnalysis.com)

A few things to note:

*SPY is trading at 185.43

*The breakeven price for this position is 177.78

*There are only 17 days left until option expiration (so if SPY can stabilize at all these options will start to lose time premium quickly)

*The maximum profit potential is $456 and will be realized if SPY is at 178 or higher as of Feb 26.

*The maximum loss is $2,544 but would only be realized if we still held the position at option expiration and SPY was at 173 or below

*A natural stop-loss level might be just below the breakeven price of 77.78.  If hit a loss of almost $0 to as much as -$800 depending on whether that level is hit later or sooner.

Summary

Again, I am not telling you that this is a great trade and that I am recommending it.  What I am telling you is that it is a great example of “things to look for” that might make a bull put spread a good choice of strategy:

*An oversold market (or one that appears like it might move sideways to higher)

*High implied volatility

*A “line in the sand” support level that can serve to tell us when we are wrong (price above support = “right”; price below support = “wrong”).

Jay Kaeppel
 

Turning a Short-Term SLV Trade into a Long-Term SLV Trade

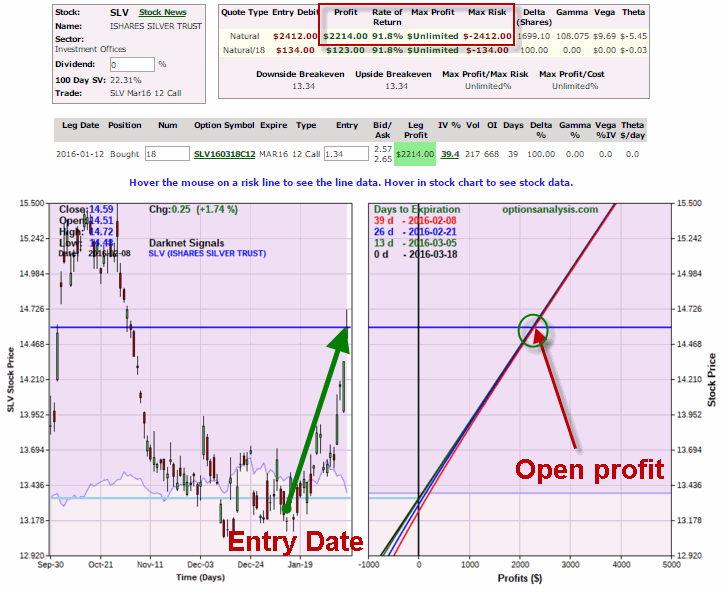
In this article I highlighted an example trade that involved buying March call options on ticker SLV based on the idea that SLV price action had formed a “multiple bottom.”

In this follow up article I highlighted one possible adjustment to the original trade, albeit one that was very premature and – as the article stated – which forfeited a great deal of upside potential.

(See also The Directional Condor)

Since the original article SLV has risen from $13.17 to $14.59 a share and the March 12 call option has risen from $1.34 to $2.57.  Based on an original 18-lot and a risk of $2,412, this trade has gained $2,286 in value, or +95%.  See Figure 1.

(click to enlarge)0Figure 1 – Updated SLV March 12 call trade (Courtesy www.OptionsAnalysis.com)

If you held this position and are still expecting SLV to continue to rally further between now and March option expiration there is no need to “do something” at this time.  But the point of this article is simply to highlight the possibilities available to you when you trade options.  So let’s look at one (of many) potential adjustments to the original trade given the recent run up in the price of SLV.

Adjusting to Lock in Profit and Buy (a lot) More Time

So here is the adjustment:

*Sell 18 SLV March 12 strike price calls @ 2.57

*Buy 10 SLV Jan 17 15 strike price calls @ 1.42

*Sell 10 SLV Jan 17 22 strike price calls @ 0.22

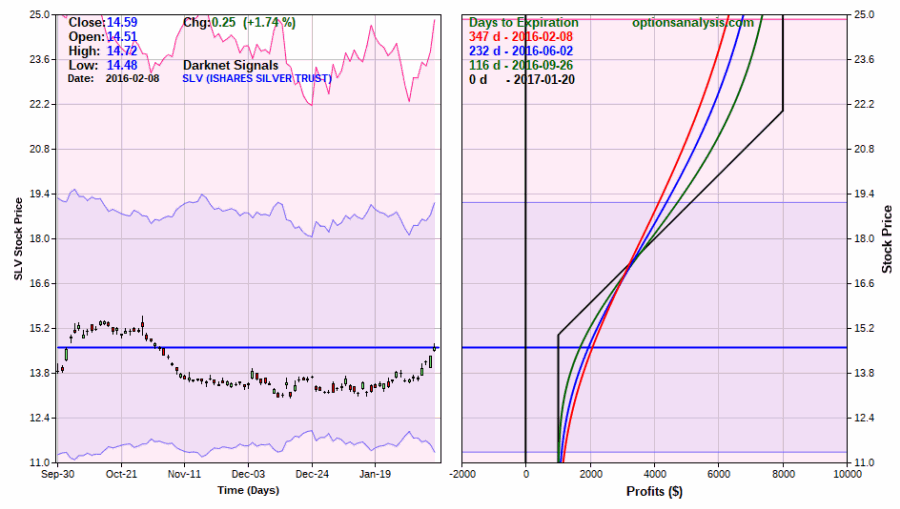
Executing this adjustment results in the position displayed in Figures 2 and 3.0aFigure 2 – Adjusted SLV trade (Courtesy www.OptionsAnalysis.com)

0bFigure 3 – New Risk Curves for Adjusted SLV trade (Courtesy www.OptionsAnalysis.com)

Pros:

*A minimum profit of $1,014 is locked in (versus a risk of -$2,412 for the original trade)

*This trade has 347 days left until expiration (versus only 39 days for the original trade)

Cons:

*If SLV continues to rally between now and March option expiration this adjusted trade has much less profit potential (original trade has a Delta of 1773 so will make roughly $1,733 if SLV rises another $1 per share.  The adjusted trade has a Delta of 408 so will only gain $408 if SLV rises another $1 per share).

Summary

Option trade adjustments are something of an “art” rather than a science.  A trader is compelled to rate their priorities for any given situation.

For example:

*If you feel strongly that SLV is going to continue to push higher (or at least not reverse sharply) between now and option expiration then holding the original trade offers the greatest profit potential

*On the other hand, if you prefer to give SLV more time to move higher and/or you want to eliminate the risk of loss on the trade, then the adjustment highlighted here might make sense.

The keys are to:

*Calmly and rationally consider your priorities

*Take the proper action (or no action at all depending on your priorities)

*Do not beat yourself up if your choice ultimately proves not to be optimum

When it comes to trading as in life – paraphrasing here – “Stuff happens”

Jay Kaeppel
The Directional Condor

For too many people the model is basically, “The stock market goes up I make money, the stock market goes down I lose money.”  As I have already demonstrated here, here, here and here, there are ways to make money that are not reliant on a bull market in the stock market. In addition, via the use of options you can “craft” a position to achieve just about any objective you have in mind. So today let’s take a look at another trading possibility that most people will never consider.

Ticker SPY

Ticker SPY is an ETF tracks the price of the S&P 500 Index.

Figure 1 displays the bar chart for ticker SPY.1Figure 1 – Ticker SPY price with implied volatility; Price oversold, implied option volatility high (Courtesy www.OptionsAnalysis.com)

As you can see:

*We have seen a sharp sell off into an oversold condition

*We have a “line in the sand” support level of 181.02

*Implied option volatility is well above average (implying that there is above average time premium built into the price of SPY options)

So let’s say a trader wants to find a trade that:

#1. Enjoys unlimited profit potential if SPY rallies

#2. Can make decent money if SPY remains relatively unchanged

#3. Can make decent money as long as SPY remains above the previous low

#4. Can take advantage of a potential decline in implied option volatility

OK, that’s kind of asking a lot, but let’s see what we can come up with.

The Directional Condor Spread

Take a look at the trade presented in Figures 2 and 3.  With ticker SPY trading at 191.21 this trade involves:

*Buying 6 Mar 206 calls @ 0.25

*Selling 4 Mar 204 calls @ 0.42

*Selling 4 Mar 182 puts @ 2.92

*Buying 4 Mar 177 puts @ 1.96

2Figure 2 – SPY Directional Condor Spread Details (Courtesy www.OptionsAnalysis.com)

3Figure 3 – SPY Directional Condor Spread Risk Curves (Courtesy www.OptionsAnalysis.com)

A few things to note:

*The trade has unlimited profit potential and will earn the initial credit of $402 if SPY is between 182 and 204 at March expiration.

*The maximum risk (and the amount need to put up to enter the trade) is $1,598. However, a loss of this size would only be realized if the trade is held until March option expiration and SPY is at or below 177.00 at that time.

*If we trigger a stop-loss if SPY drops below $181, the resulting loss on the trade will be roughly -$425 to -$450.

So let’s go back to or original “Wish List”

#1. Enjoys unlimited profit potential if SPY rallies?

SPY would have to rally fairly significantly to rack up large gains.  Still, unlimited potential exists; unlike with a standard consider spread.

#2. Can make decent money if SPY remains relatively unchanged?

The trade will earn a profit of $402 if SPY is between 182 and 204 at March expiration

#3. Can make decent money as long as SPY remains above the previous low?

SPY is trading at $191.21.  The recent low was 181.02 and the breakeven price on this trade is 180.99.

#4. Can take advantage of a potential decline in implied option volatility?

See Figures 4 and 5.

If Volatility Falls

In the stock market, stock index option implied volatility typically (though not always), rises when the stock market falls and declines when the stock market falls or remains neutral.  So if SPY rises or meanders then chances are implied option volatility will fall. Because this trade involves “selling premium” it can benefit from declining volatility.

Figure 4 displays the risk curves through 3/3/2016 for this trade and highlights the expected profit if price and volatility are unchanged at that time (expected open profit = +$213).4Figure 4 – If price and volatility unchanged as of 3/3/16 (Courtesy www.OptionsAnalysis.com)

Figure 5 displays the risk curves through 3/3/2016 for this trade and highlights the expected profit if price is unchanged BUT volatility declines by 25% from current levels by that time (expected open profit = +$320).5aFigure 5 – If price is unchanged BUT volatility declines by 25% as of 3/3/16 (Courtesy www.OptionsAnalysis.com)

Summary

Is this a good trade?  That depends on how you define “good”. If you had the objectives listed earlier than this trade creates the opportunity to take advantage of the present price and volatility action for SPY.

Is this destined to be a profitable trade?  That’s another question altogether.

Jay Kaeppel


One of My Favorite Chartists May be Getting Bullish on Metals

For most of us, chart patterns are pretty obvious in hindsight and not always so obvious in real-time.  Most of us.  But not all of us.  As with any endeavor some people are just better at certain things than others.  This holds true for looking at and accurately interpreting chart patterns as they unfold.

I have known and/or followed several analysts who possess this ability.  One of them is gentleman named Peter Brandt.  And according to his latest post, he may be turning bullish on gold and silver

Definitely worth a read.

If that is not enough on the topic, see the articles below from JayOnTheMarkets.com:

So Who Wants to Pick a Bottom in Gold Stocks?

Taking My (Gold Stock) Ball and Going Home

Catching the Falling SLV Safe

Jay Kaeppel
Bonds Rally…Not Everyone is Surprised

In 2015 there was a great deal of “fear and loathing” related to the bond market.  With speculation rampant that the Fed would “finally” raise interest rates, there seemed to be a growing sense of inevitability that the 30-year bull market in bonds was about to end.

And perhaps it will.  But as it turns out, it looks like bonds may not go down without a fight.

(See also This is What a Classic Bottom Formation Looks Like (Maybe?))

In Figures 1 and 2 you see updated versions of two charts I included in this article.

1Figure 1 – Bonds breaking out of a narrowing channel (Courtesy ProfitSource by HUBB)

2

Figure 2 – Weekly Elliott Wave count still suggesting a potential bull move for bonds (Courtesy ProfitSource by HUBB)

Likewise in this article I discussed the fact that the U.S. treasury bond market typically trades inversely to the Japanese stock market.  Figure 3 displays the performance of t-bond futures (a 1-point move in t-bond futures = $1,000) since 12/31/97 when ticker EWJ (an ETF that tracks the Japanese stock market) is:

*In a downtrend (i.e., the 5-week moving average is below the 30-week moving average), which is bullish for t-bonds (red line)

*In an uptrend (i.e., the 5-week moving average is above the 30-week moving average), which is bearish for t-bonds (blue line)

3Figure 3 – T-bond performance when EWJ indicator is bullish for bonds (red line) versus bearish for bonds (blue line) 12/31/1997-Present

Although the bull and bear track record is far from perfect, the point is that there is clearly a difference in performance between the two.  As you can see in Figure 4, EWJ remains in a firm downtrend (note at far right of bottom clip that 5-week MA is well below 30-week MA), which i.e., is theoretically bullish for bonds.

4Figure 4 – Ticker TLT with buy signals from ticker EWJ

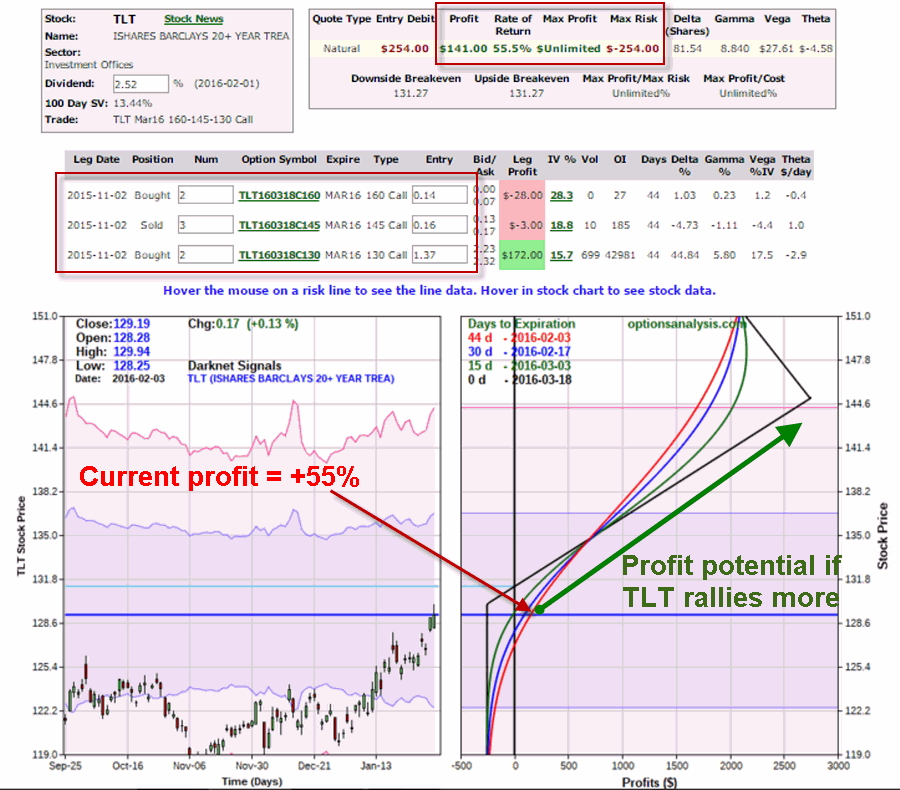
Will bonds continue to rally?  It beats me.  Still the “Risk a few bucks on the chance that bonds surprise the heck out of everyone and rally like crazy” trade that I highlighted in the article is now showing a profit of 55% and is poised for huge gains if by chance this rally somehow continues. 5

Figure 5 – OTM Directional Butterfly Spread using options on TLT  (Courtesy www.OptionsAnalysis.com)

Which is entirely the point of the “Risk a few bucks on the chance that [chosen market/stock/ETF/index here] surprise the heck out of everyone and rally like crazy” trade.

One caveat: As is always the case in the markets, you can see whatever you wan to see in any situation.  While most of what I have showed so far is “bullish” for bonds, still TLT is a bit “overextended” at the moment and is in a key resistance range as you can see in Figure 6.6 Figure 6 – TLT up against resistance? (Courtesy AIQ TradingExpert)

Summary

I am not telling you to be bullish on t-bonds.  Nor am I telling you that the recent rally in bonds is about to peter out.

I am telling you that when “Everybody Knows” that bonds [or whatever] can’t possibly advance in the face of the Fed raising rates [or whatever]……there is a good chance that “Everybody Knows Nothing.”

Jay Kaeppel
 

A Valuable 9-to-1 Update from Quantifiable Edges

If you are looking for something (ANYTHING!!) to make you hopeful about the stock market in the months ahead please click the link below.

Long-Term Implications of Last Week’s Breadth Thrust|

The study was done by Rob Hanna of QuanitifableEdges.com.  Rob is one of those guys who makes me mad because he finds all kinds of market anomalies/trends/quirks/etc.  that I don’t.

Curses, he’s done it again…..

(See also This is What a Classic Bottom Formation Looks Like (Maybe?))

Jay Kaeppel

This is What a Classic Bottom Formation Looks Like (Maybe?)

Last week I published an article titled This is What a Classic Top Formation Looks Like which highlighted some recent action in the sugar futures market that served as a classic example of a “top formation”, complete with test, retests, thrusts, false breakouts and of course the inevitable breakdown.

Which all proves once again that finding top formations in hindsight is pretty darned easy.

Figuring things out in real-time is typically a little tougher.  For when even the most “classic” top or bottom appears to be forming perfectly, there always remains the chance that “things won’t work out as planned this time around.”  So with that caveat firmly in mind let’s direct our attention to the May Soybean futures contract (BTW: if you have not the slightest interest in soybeans please not that the example is meant to serve as, well, an example of a classic potential bottom formation and not necessarily as a recommendation to trade soybean futures).

To get the “gist” of the idea please peruse Figures 1 through 4 below.0Figure 1 – May Soybeans; the initial decline (Courtesy: ProfitSource by HUBB)

1Figure 2 – May Soybeans; failed breakdown (Courtesy: ProfitSource by HUBB)

2Figure 3 – May Soybeans; another failed breakdown (Courtesy: ProfitSource by HUBB)

The basic “gist” of the idea is that the market in question tried repeatedly to break down below the 853-860 range but failed to break through.  Thus there is a “line in the sand” support level at 853.50 as shown in Figure 4.  3Figure 4 – May Soybeans and the “Line in the Sand” support (Courtesy: ProfitSource by HUBB)

As long as price remains above the “line in the sand” a trader might consider a bullish position with a stop below that recent support level.  Several choices include:

*Buy at the market – Gets you in immediately.

*Buy on a breakout above recent resistance – Forces the market to move in the right direction before getting in.  Also results in buying at a higher price, i.e., greater $ risk.

*Buy on a dip closer to the “line in the sand” – Lower dollar risk by buying closer to the stop-loss level; But also exposes trader to  the potential “like a hot knife through butter” scenario if the next decline is the one that actually breaks through to the downside.

*Enter a bullish position using options.

*Do nothing.

Adding Other Confirmations to the Mix

Let’s add a little more potential confirmation to the mix.

In Figure 5 we see that the weekly (top clip) and daily (bottom clip) Elliott Wave counts completed 5 waves down in late November 2015.  This suggested that the major decline that beans encountered had finally (possibly) run its course.  And while a new rally has yet to unfold, beans have since held their ground and attempted to build a base.

(click to enlarge)4Figure 5 – May Soybeans; Daily and Weekly Elliott Wave counts complete 5 waves down (Courtesy: ProfitSource by HUBB)

Seasonality

Let’s add one more theoretically bullish factor to the mix.  As you can see in the Seasonal tendency chart for soybeans that appears in Figure 6, beans have shown a historical tendency to advance between early February and mid-June.6aFigure 6 – Soybean Annual Seasonal Tendency

Please note the use of the words “historical” and “tendency” and the lack of the words “sure” and “thing” and “this year”.  Still, we are now at the cusp of what is often the best part of the year for beans.

Putting it All Together

So what we have is this – a market that:

*Has built a strong technical base with a clearly identifiable support level

*Has completed 5 waves down on both the daily and weekly charts, and;

*Is about to enter a seasonally favorable period of several months.

Wow – this looks great!  I mean, what could possibly go wrong?  Ah, there’s the rub. Because nothing – no indicator, oscillator, chart pattern, wave count, or any combination thereof, i.e., nothing – is ever guaranteed to work out as suggested/hoped when it comes to trading.  So let’s look at this from a no nonsense trading perspective.  One hypothetical approach would be to buy the next breakout and place a stop below recent support.

As shown in Figure 7 using May soybean futures, a trader could consider buying beans if it takes out the recent high of 887 and sell if price drops below the recent low of 853.25.

5Figure 7 – Risk associated with buying May Soybeans (Courtesy: ProfitSource by HUBB)

This hope of course is that beans will move higher instead. But in this worst case scenario a trader would be risking $1,712.50 per contract (bean futures trade at $50 a point).

Summary

As always, this blog is intended to be “educational” and not necessarily “actionable”. In other words, the purpose of this article is not to help you decide whether or not to buy soybean futures.

The real point of this piece is to alert you to a potential pattern that can be used to trade in any number of situations:

*A technical chart pattern that that involves a market/stock/index/ETF/currency/etc. trying repeatedly to breakdown but being unable to do so.

*Combining other factors (Elliott Wave and Seasonality in this case) can help to build a stronger case.

Still one can’t but help but to wonder, are soybeans ready to rally and is it worth risking at least $1,712 to find out?

As always, only time will tell.

Jay Kaeppel
 

Is it “ByeOtech” or “BuyOTech”?

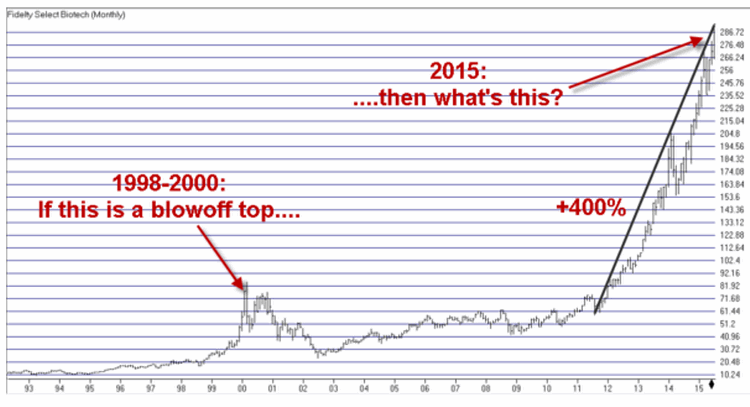
I am not sure I know the answer to the question posed in the headline.  But I do know one thing – biotech stocks are getting killed.  If only somebody had warned us that something like this might happen…..Oh, wait, somebody did.

In case you were not aware, biotech stocks (using Fidelity Select Biotech, ticker FBIOX as a proxy) are now 43% off of the high made on July 17th, 2015.  On July 17, 2015 I posted an article that included the ominous chart that appears in Figure 1.

1

2Figure 1 – Chart from July 17, 2015 article

Now here’s the interesting paradox. Technically I could argue that I did in fact “call the top”.  But if you reread that article you will note that I never actually said “Sell.”  It pains me to say it but the fact that FBIOX topped on the very day I wrote the above article is coincidence not prescience.  The point of that article was not to “call the top” but simply to warn that danger appeared to be imminent.  Imminent indeed.

The other point is that if you are in this business long enough (for example, from say the “Hair Era” in your life to the “Not So Much Hair Era”, but I digress) you will see that various patterns repeat, um, repeatedly (See here and here).  If you are paying attention and not afraid to act you can actually do yourself some good (regardless of whether the S&P 500 is rising or falling).

The Difference Between Theory and Reality

There is an important distinction to be made between “theory” and “reality” when it comes to investing and trading.  In theory, picking a top sounds like a great idea.  In reality, attempting to “call the top” is typically foolish.  However, in reality, recognizing danger when it exists is one of the most valuable skills you can develop.

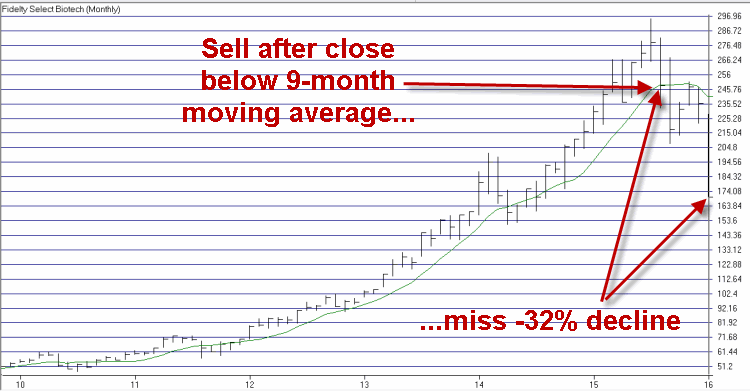
So speaking of reality, consider this example. The chart that appears in Figure 1 provides a warning of danger.  Now just suppose you applied something as simple, basic and mundane as a 9-month moving average to FBIOX and decided to sell if and when price drops below said moving average.  As you can see in Figure 2, you might have sold FBIOX at the end of August 2015 and avoided a further -32% decline in price from that point.3Figure 2 – FBIOX with a 9-month moving average (Courtesy AIQ TradingExpert)

The bottom line: It really doesn’t have to be rocket science.

Jay Kaeppel


This is What a Classic Top Formation Looks Like

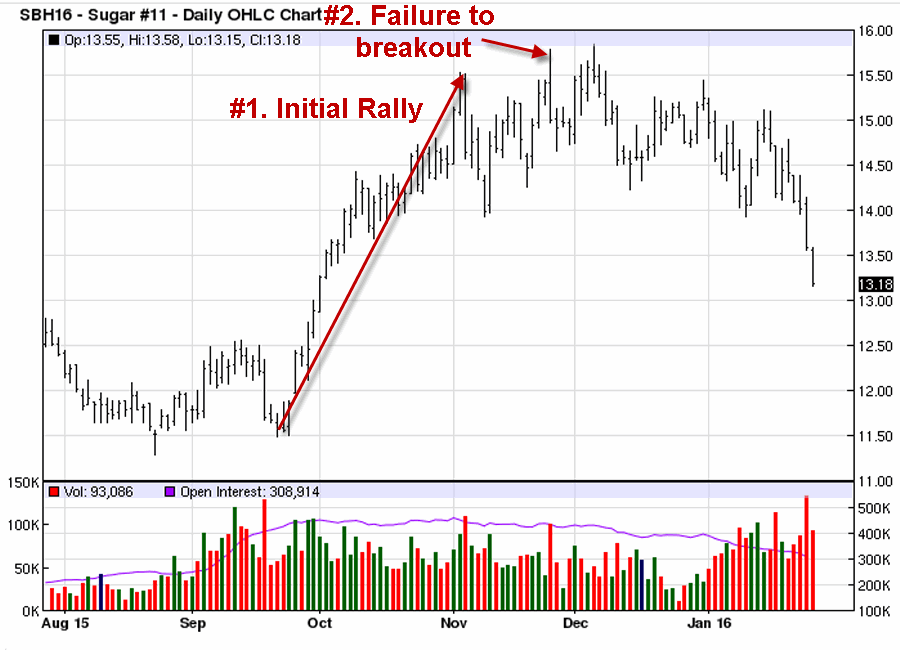
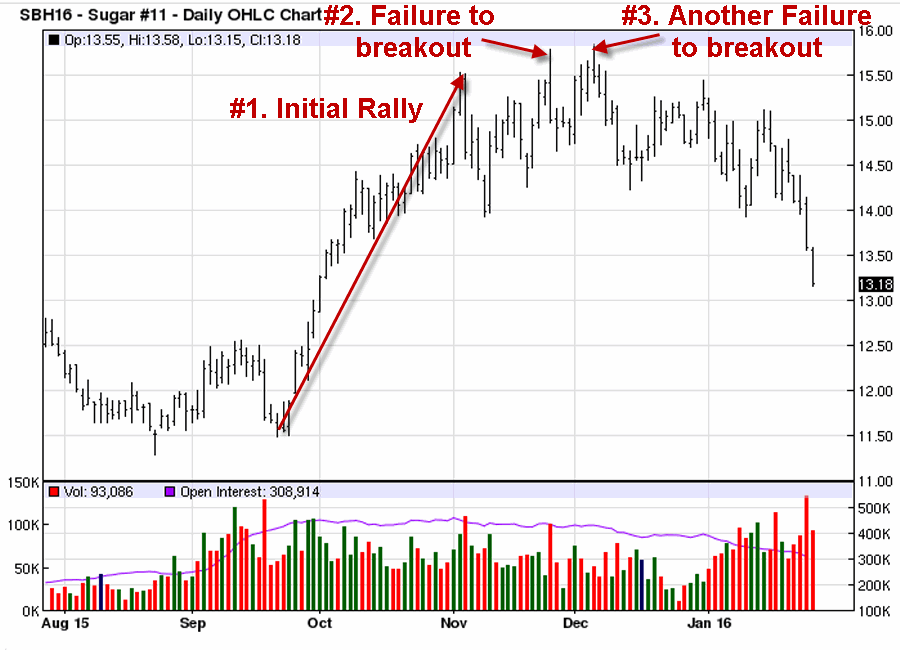
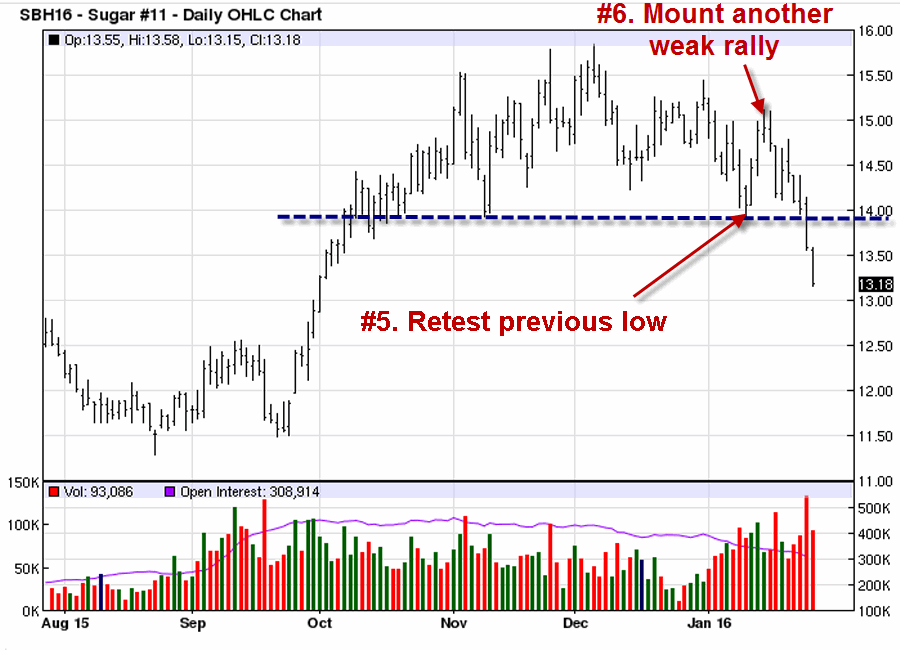
Let’s step back from the world of quantitative analysis and plunge headlong into the entirely subjective realm of reading chart patterns. I make no claim to be a great “chart trader”, but I have looked at enough charts that I know a “classic top formation” when I see one.  Like the one that just played out in the sugar market.

(See also A Two-Fund Portfolio for the Next Three Months)

Now granted only a very small segment of the trading population cares much about the sugar market.  But its not the market displayed that matters, but rather the pattern.  In other words, the point here is that what appears below can happen with any market, stock, ETF, currency, etc.

I am going to present this without further commentary as it is either self explanatory from the information in the charts, or its not (OK, that and the fact that I am lazy….)

Roll em…..

0Figure 1 – Initial rally and top

2Figure 2 – Pullback, rally and a failed breakout

3Figure 3 – Another pullback, then rally and another failed breakout

4Figure 4 – A pullback followed by a very weak rally (that fails to retest the earlier high)

5Figure 5 –  A retest of an earlier low within the pattern(which creates a “Line in the Sand” support level) followed by another weak rally

Figure 6 – The “Line in the Sand” is broken….and the party is  over

If you peruse enough different charts on a regular basis you will see this pattern play out on a surprisingly regular basis.

Jay Kaeppel