All posts by admin

Another SLV Setup?

As I have written about here, here and here, it’s not been a bad year to be bullish on silver.  There is some evidence to suggest that the big “jump” on 6/3 may be a sign of still more bullish things to come (although – as I also wrote about here and here we are still in something of a potential “danger zone” through 6/25).

The purpose of this blog is not to make recommendations but to pass along “ideas” and also to educate traders and investors regarding how to look at the markets in unique ways in order to (hopefully) learn to spot unique opportunities.  So let’s take a closer look at an “idea” for silver.

Elliott Wave

When it comes to Elliott wave analysis, for the record I am not a full-fledged “Elliott Head”.  Typically I am only interested when the weekly and daily Elliott Wave projections (I use ProfitSource by HUBB to view these) are either both bullish of both bearish. Figure 1 displays the weekly count for ticker SLV (the ETF that tracks the price of silver).  As you can see, it:

*Completed a 5-wave pattern down

*Broke to the upside

*And has since pulled back (in theory setting the stage for another move up)

(Click to enlarge)1aFigure 1 –Weekly Elliott Wave count for ticker SLV (Courtesy ProfitSource by HUBB)
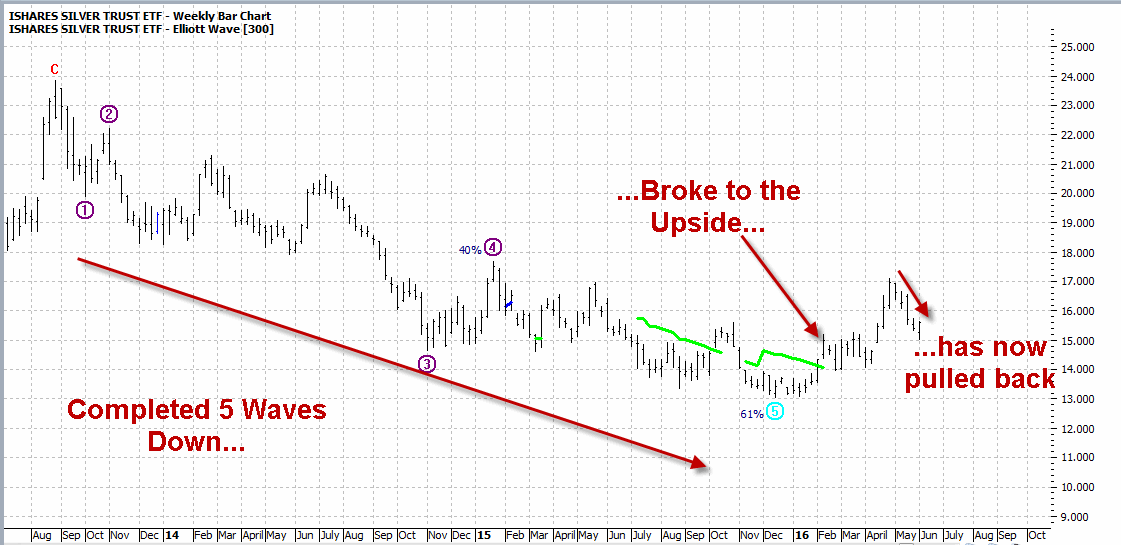
Figure 2 displays the daily count for SLV.  As you can see the 6/3 advance broke above the Elliott Wave signal line and could be the start of a new Wave 5 advance. The projected target range is $17.70 to $18.64.

(Click to enlarge)1Figure 2 – Daily Elliott Wave count for ticker SLV (Courtesy ProfitSource by HUBB)

Important Note: These “projections” are just that. Sometimes these things work out great and sometimes they don’t. No one should assume that this is some sort of “sure thing.”  The real question is “Are these weekly and daily EW counts and projections enough to compel you to act?”

If your answer is “No”, then please feel free to stop reading (but thank you for staying with me this far and please check back soon).

If your answer is “Yes”, “Maybe”, “I dunno” or “What kind of action did you have in mind?” then let’s look a little closer.

Implied Option Volatility

The most straightforward action for a person who is bullish on SLV is to buy 100 shares of SLV at $15.61 for $1,561.  But there are less costly alternatives.  One possibility is to buy a call option on SLV.  However, before buying a call option on any security it is helpful to know whether the ”implied volatility” for options on that security is presently high or low.  Without getting into a long explanation let’s just say that if implied volatility is “low” then the options will cost less to buy (because there will be less “time premium” built into the price) and if implied volatility is “high” then the options will cost more to buy.

As you see in Figure 3, the IV for SLV options is presently neither high nor low but rater somewhere in the middle.  So based on this we are going to consider an alternative strategy to simply buying a call option.

(Click to enlarge)2Figure 3 – Implied volatility on SLV option “in the middle” (Courtesy www.OptionsAnalysis.com)

A closer look at Figure 2 reveals that the Elliott Wave projection range of $17.70-$18.64 extends through late August.  This suggests that we should look out to at least September options. So we will look to buy the slightly in-the-money September 15 strike price call option.

Also, because IV is not “cheap” we will look to offset some of the cost of the option we buy by selling something.  In this example we will sell the January 2017 20 strike price call.  The particulars for this trade appear in Figure 3 and the risk curves in Figure 4.

(Click to enlarge)3aFigure 3 – Long Jul SLV 15 call / Short Jan 20 call (Courtesy www.OptionsAnalysis.com)

(Click to enlarge)4aFigure 4 – Long Jul SLV 15 call / Short Jan 20 call risk curves (Courtesy www.OptionsAnalysis.com)
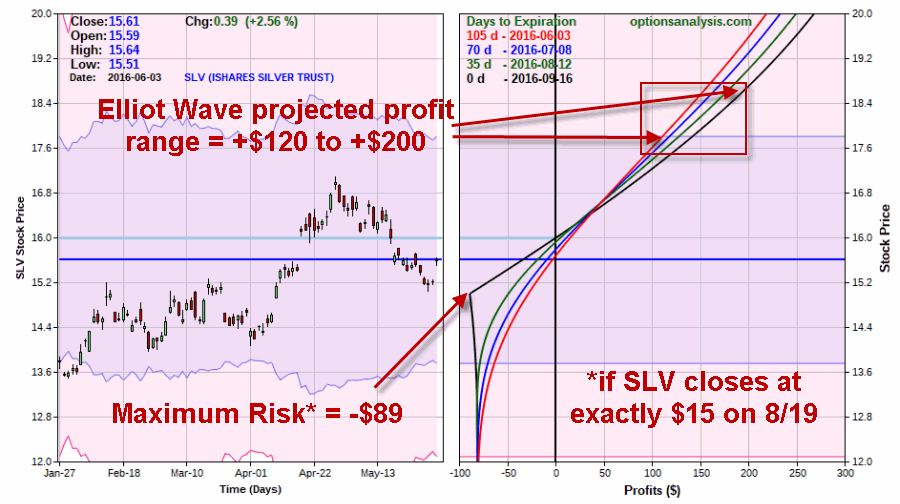
Things to note:

*The worst case scenario: SLV closes at exactly $15 a share on September 16th (Sep. option expiration date). In that scenario the trade will show a loss of -$88.90 (and technically we would be short one January 20 call, so we would need to either close out that position or buy another long call to cover the short January 20 call. If we do nothing we will be short a naked call which involves margin requirements and unlimited risk).

*If the Elliott Wave projections prove to be accurate: Then we should look to take a profit with SLV somewhere in the $17.70 to$18.64 range. Depending on the price for SLV and the amount of time it takes to get there our profit would likely be somewhere in the $120 to $200 range.

Summary

Is silver launching a new upleg? Maybe.  The weekly and daily Elliott Wave counts are suggesting that positive action maybe in store in the months ahead. That being said silver remains in an unfavorable seasonal period through the close on 6/25 so be forewarned that this “idea” may be a bit premature.

Still, the purpose of the trade detailed in this piece is not to serve as an immediate “call to action”.  The primary purpose is to illustrate one way to combine a variety of factors (Favorable Weekly and Daily Elliott Wave setups) and to figure out a low-cost way to take advantage of the situation (in this case by buying an in-the-money shorter-term call option while selling a far out-of-the-money longer-term call options in order to offset some of the cost

 Jay Kaeppel


One Example of the Summer Credit Spread

In this article I wrote about the tendency for the stock market to struggle during the summer months.  In this article I wrote about one way to use options to potentially take advantage of the fact that stocks tend to struggle during the summer.  Now in this piece I will walk through an example that we can follow through to conclusion.

Two key things to note:

1. The example presented here is an “example” and not a “recommendation”

2. If you are absolutely sure that you will never trade an option during your lifetime, you are dismissed from class early today (but Thank You for checking in and please be sure to come back soon)

The Summer Credit Spread

This example uses www.OptionsAnalysis.com.  The best endorsement that I can give this site is to say that, a) I use it for all of my own, um, option analysis (what else?) and, b) in the 90’s I helped write option software that was voted “Best Option Trading System” in Technical Analysis of Stocks & Commodities magazine 6 years in a row.  But when I started using OptionsAnalysis I stopped using my own software (Yes, it breaks my heart, but better is better).

Step 1: Heavily traded options with tight bid/ask spreads 

In OA go to Website | Lists | Filter Lists

I have set up a wizard with the settings shown in Figure 1.  The idea is to find stocks with option bid/ask spreads under 2% and average trading volume of at least 1,000 options a day.1Figure 1 – Filter List setup (Courtesy www.OptionsAnalysis.com)

Click “Search” to generate output results which appear in Figure 2.2Figure 2 – Filter List Output (Courtesy www.OptionsAnalysis.com)

In this example 141 stocks passed the filter.  Click “Replace” to save those 141 stocks to “My Stock List”

Step 2: 2-Day RSI of 90 or higher

Go to Stocks | Rankers | RSI

I have set up a wizard with the settings that appear in Figure 3.  The purpose is to find stocks from our filtered list that are short-term overbought.3Figure 3 – RSI Setup (Courtesy www.OptionsAnalysis.com)

The output results appear in Figure 4.  Note that 14 of the 141 stocks in “My Stock List” meet the RSI criteria.  Click “Replace” to save only those 14 stocks to “My Stock List”.4Figure 4 – RSI Output (Courtesy www.OptionsAnalysis.com)

Step 3: Look for Bear Call Credit Spreads

Go to Searchers | Multi – Strategies | Find Trades ++

I have setup a Wizard with the settings shown in Figures 5 and 6.5Figure 5 – Bear Call Credit Spread Settings (Courtesy www.OptionsAnalysis.com)6Figure 6 – Bear Call Credit Spread Settings

(Courtesy www.OptionsAnalysis.com)

From our list of 14 stocks we are looking for call credit spreads for:

*Stocks trading at $10 a share or higher

*A probability of profit of 75% or higher

*14 to 45 days left until option expiration

*A delta of less than 50 for the options traded (i.e., we will only consider out-of-the-money call options, i.e., those with strike prices above the current price of the stock)

Click “Search” to generate results

The output list appears in Figure 7.

7Figure 7 – Strategy Search Output (Courtesy www.OptionsAnalysis.com)

Step 4: Identify a Trade with Good Reward-to-Risk Ratio

Let’s take a closer look at the top rated trade which involves:

*Ticker LULU with the stock trading at $64.69 a share

*Selling the June 67.5 call

*Buying the 72.5 call8Figure 8 – LULU Jun 67.5/72.5 call credit spread details (Courtesy www.OptionsAnalysis.com)

Key things to note from Figure 8 (which assumes trading a 7-lot):

*The maximum profit potential is +$910 (+35.14%)

*The maximum risk is -$2,590

*The breakeven price at expiration is $68.80 (current stock price is $64.69)

*There are 21 days left until expiration

Figure 9 displays the risk curves for this trade with each colored line representing the expected profit or loss based on a given price on a specific date leading up to option expiration (the profit/loss at expiration is represented by the black line).9Figure 9 – LULU Jun 67.5/72.5 call credit spread risk curves (Courtesy www.OptionsAnalysis.com)

Step 5: Plan out Position Management

Now let’s look at this trade from a position management perspective.  If the stock starts to rally the last thing we want to do is sit around and wait to absorb the maximum loss of -$2,590.  So let’s set the recent high of $69.73 as our “line in the sand.”  If that price is taken out in any meaningful way we can justifiably say “we are wrong” and take our loss.

Figure 10 “zooms in” a bit from Figure 9.10Figure 10 – LULU call credit spread with a stop-loss point (Courtesy www.OptionsAnalysis.com)

As you can see in Figure 10, if we place a stop-loss point just above $69.73, and we exit if that price is hit then the expected loss is somewhere between -$800 and -$900, depending on how soon that price is hit.  While this is not an appetizing prospect, the point is that by placing a stop-loss above  the recent high we turn this trade from a 1-to-2.84 reward-to-risk ratio to roughly a 1-to-1 proposition, and the stock has to rally over 8% in three weeks to trigger our stop-loss.

And remember that this trade makes money at expiration if LULU is at any price below $68.60 at expiration.

On the profit-taking side, one might consider closing the trade prior to expiration if 80% to 90% of the maximum credit can be captured.  In this case that would mean taking a profit somewhere between $830 and $920 if such a profit becomes available prior to expiration.

Summary

So is this a “good” trade.  It depends on how you define “good” I guess.  If you define “good” as “it’s a sure thing that’s guaranteed to make money”, then the answer is “No.”   If you define “good” as “selling premium on a stock that is short-term overbought and entering a position that can make money as long as the stock does anything other than rally +6.3% over the next three weeks while identifying a natural resistance point to use as a stop-loss that greatly reduces the likely dollar risk on the trade”, then the answer is “Maybe.” (It also suggests that you could use slightly less long-winded definitions of simple words like “good” – but let’s not worry about that right now…..)

Jay Kaeppel

Fading Through the Door into Summer

An ancient proverb states that “There is a fine line between efficiency and laziness.”  Lazy people are especially fond of this particular proverb.  And hey, we efficient people are totally insulted.

Anyway, be all that as it may, we are headed into the “summer months”.  Or as I refer to them, “The Black Hole Formerly Known as Summer.”  Rather than rehash articles that I have written in the past, I am going to be “efficient” and encourage you to explore the two links below.

(See also Beware the Middle of May – The “unfavorable mid-May period” ended at the close on 5/23.  On 5/24 Dow rose 200+ points…coincidence?)

The Bottom Line on Summer

In a nutshell, sometimes stock prices rise in the summer, sometime they fall and sometimes they pretty much go nowhere.  The bottom line is that $1,000 invested in the Dow Jones Industrials Average ONLY during June, July and August since 1965 is now worth $1,004.

Please see:

The Stock Market Black Hole (formerly known as “Summer”)

Not exactly the kind of returns most of us are looking for.

For those willing to “think outside the box” and consider alternative strategies to “buy and hold” there may be a way to improve summer returns.

Please see:

One Way to Play the Stock Market Black Hole (i.e., “Summer”)

Hey, at least we can enjoy the weather!

Jay Kaeppel

Health Care Monthly Meds

It is not a secret that the stock market tends to perform better during the end of month/beginning of month and middle of month periods than during the rest of the month.  What is less known is that certain sectors tend to perform even better than the overall market during these time periods.

(See also Where NOT to Invest, Er, Soon  (Part 1))

Jay’s Seasonal Health Care Strategy

As always, what follows is not a “recommended trading strategy”. It is presented solely as “food for thought” (or perhaps I should say “meds for thought”).  Anyway, for illustrative purposes we will adopt an aggressive trading strategy as follows:

*We will use Health Care UltraSector ProFund (ticker HCPIX, which tracks the Dow Jones U.S. Health Care index using leverage of 1.5-to-1; so I the index rises 1% today the fund should rise 1.5%);

We will hold HCPIX ONLY on:

*The last 4 trading days of the month

*The first 2 trading days of the month

*Trading days numbers 9, 10, 11 and 12 each month

The rest of the time we will hold cash; For the purposes of this test, no interest is assumed to be earned while out of HCPIX

Figure 1 displays the hypothetical growth of equity using the approach.

1Figure 1 – Growth of $1,000 using Jay’s Seasonal Health Care Strategy with ticker HCPIX (6/10/2000-5/13/2016)

For the record, $1,000 starting on 6/19/2000 grew to $20,995, or +1,999%.

Figure 2 displays the year-by-year results.

2

Figure 2 – Jay’s Seasonal Health Care Strategy Year-by-Year (6/19/00-5/13/16)

One question that invariably arises when talking about a specific seasonal approach such as this is, “What do I miss by being out of HCPIX the rest of the time?” Based on my own thorough analysis I believe the answer to that question is “Pain and suffering”.

Figure 3 answers the question of what would have happened to an initial $1,000 invested in HCPIX only during “all other days” besides the ones listed earlier.3Figure 3 – Growth of $1,000 in HCPIX during all other trading days (6/10/2000-5/13/2016)

For the record, starting on 6/19/2000 (when HCPIX started trading):

*$1,000 invested only during the seasonally favorable periods grew +1,999% (to +$20,995)

*$1,000 invested only during all other days shrank -89% (to $111)

These are the kinds of disparities that we “quantitative types” refer to as “statistically significant”.

Jay Kaeppel

Another Fortuitous Adjustment for SLV

In this article dated 1/13/16 I highlighted a bullish position using options on SLV.

In this article dated 2/9/16 I adjusted the original position in order to lock in a profit, retain upside potential and extend the length of the time available for SLV to make a major move.

Things have gone pretty well. But most recently (here and here) I wrote about some potential reasons to be less than bullish about the prospects for silver –at least through late June.

So this raises the question: What to do with our SLV bullish option position?

(See also JayOnTheMarkets.com: Where NOT to Invest, Er, Soon  (Part 1))

Adjusting SLV One More Time

The current position is displayed in Figures 1 and 2.

1Figure 1 – Current SLV Open Position (Courtesy www.OptionsAnalysis.com)2Figure 2 – Risk Curves and status for current SLV Open Position (Courtesy www.OptionsAnalysis.com)

At the moment:

*The open profit is +$2,954

*The maximum profit potential is +$8,014

*The minimum profit is +$1,014

In other words, the trade could gain another $5,050 or it could give back $1,940 of the current open profit.

One choice would be to simply close the position and take the profit. But there are two factors that lead me to go a different direction:

1) Silver is “on the move” – and historically precious metals possess the potential to surprise people with just how far they can run in either direction

2) Because I trade options, it is possible to improve the existing position

The Adjustment

The adjustment goes like this:

*Sell 10 Jan2017 SLV 15 calls

*Buy 10 Jan2017 SLV 22 calls

*Sell 9 Jan2017 SLV 17 calls

*Buy 9 Jan2017 SLV 24 calls

Among options geeks – er, sorry, I mean options “traders” – this is typically referred to as “rolling up”, and we are exiting a position at lower strike prices and trading new options with higher strike prices.

The net effect of this adjustment appears Figure 3 and 4.3Figure 3 – New SLV position after adjustment (Courtesy www.OptionsAnalysis.com)

4Figure 4 – New risk curves for adjusted SLV position (Courtesy www.OptionsAnalysis.com)

The net effect is this:

*The days left until expiration remains unchanged at 253

*The open profit drops from $2,954 to $2,900 due to bid/ask spreads

*The maximum profit rises from $8,014 to $8,257 (an increase of $243)

*The minimum profit rises from $1,014 to $1,955 (an increase of $941)

In sum:

*We still have 8 months left until expiration just in case silver decides to go crazy to the upside.

*We increased our profit potential by almost $250

*We locked in another almost $950 of profit.

Not a bad day’s work

Jay Kaeppel

Where NOT to Invest Right Now (Part 2)

In this article I noted the fact that:

a) Non-commercial speculators are very “long” silver futures while Commercial hedgers are very “short” silver; and

b) Silver enters a seasonally unfavorable period at the close on 5/12.

For the record, I also pointed out that:

a) Non-commercial speculators are not always wrong and commercial speculators are not always right, but when they are at extremes it can be a useful warning – at least in the short-term.

b) Seasonal trends don’t always persist each and every time around (and that metals can be a dangerous market to be on the wrong side of when they are moving strongly).

One without the other may not be worthy of mention, but when these two pieces are in place, at the very least it gets my attention.   Today let’s add one more potential reason for short-term “pause” when it comes to silver.

(See also Where NOT to Invest, Er, Soon  (Part 1))

William’s VixFix

Famed trader Larry Williams developed an indicator a number of years ago that he named “VixFix”.  Never being one to know when to leave well enough alone, I not only smoothed that indicator once, but twice to create the indicator you see in the bottom clip of Figure 1.  First a little explanation:

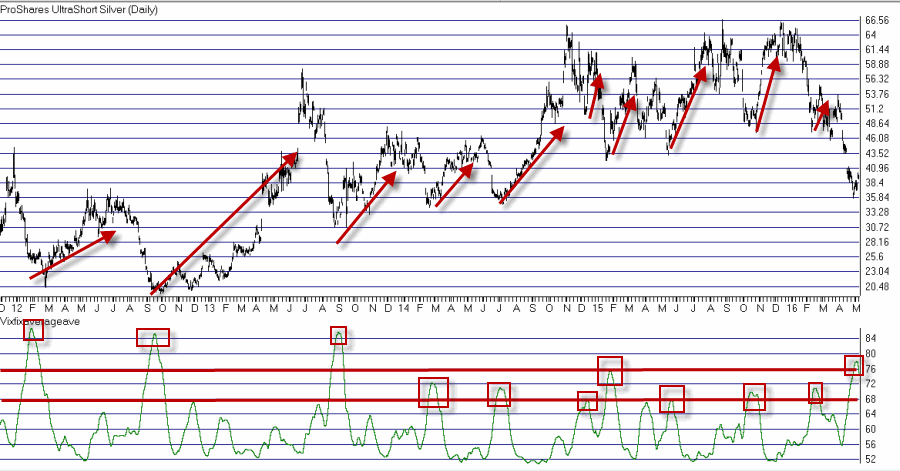
*The bar chart in the top clip of Figure 1 is for ticker ZSL which is a double-leveraged short silver ETF.  In other words, if silver declines -1% today, in theory ZSL should rise +2% today.

*As you can see in Figure 1, the indicator in the bottom clip named “Vixfixaverageave” (Note to myself: work on created slightly more coherent indicator names) rises as ZSL falls and vice versa.1Figure 1 – Inverse (leveraged) silver ETF ticker ZSL with Jay’s Vixfixavergeave indicator (Courtesy AIQ TradingExpert)

I consider “Vixfixaverageave” to be more of “perspective indicator” than a precise timing tool, however, that being said – and as you can see for yourself in Figure 1:

*Reversals that occur above 74 have typically been followed by fairly substantial advances in ZSL (i.e., meaningful declines in the price of silver).

*Reversals that don’t reach 74 but hit at least 67 also tend to highlight at least short-term rallies in ZSL

As you can see at the far right in the bottom clip of Figure 1, the Vixfixaverageave indicator topped out at 77.86 and reversed to the downside on 5/6.

Does this mean that ZSL is about to soar and that ticker SLV (the ETF that tracks the price of silver) is about to tank?  Not necessarily.  But it is one more reason to think twice about jumping on the silver bandwagon at this point.

Code for VixFix and Vixfivaverageave indicators using AIQ Expert Design Studio:

!VixFix and Vixfixaverageave code

xx is 15.

hivalclose is hival([close],22).

vixfix is (((hivalclose-[low])/hivalclose)*100)+50.

vixfixaverage is Expavg(vixfix,3).

vixfixaverageave is Expavg(vixfixaverage,7).


Jay Kaeppel

Where NOT to Invest, Er, Soon (Part 1)

Housing/Construction stocks have displayed a tendency to perform poorly starting in early June (OK, clearly I am a little early with this one – but since writing this is on my list of things to do I figured I’d just go ahead).

(See also Where NOT to Invest Right Now (Part 1))

An Unfavorable Seasonal Trend

Figure 1 below displays the net result that a trader would have “achieved” since 1989 by holding Fidelity Select Housing and Construction sector fund (ticker FSHOX) every year between:

*The end of June Trading Day #2 and;

*The end of October Trading Day #7

1Figure 1 – Growth of $1,000 invested in ticker FSHOX between June Trading Day #2 and October Trading Day #7 (Jan-1989-present)

Things haven’t been too bad since 2008, still, buying and holding ticker FSHOX only during this time period each and every year since 1989 would have generated a net loss of -71%.  Not exactly the kind of return most investors are looking for.

Now let’s flip it on its head.  What if you bought and held FSHOX during ALL OTHER DAYS of the year as follows:

*Buy ticker FSHOX at the close of October Trading Day #7

*Sell ticker FSHOX at the close of June (next year) Trading Day #2

*We will assume an annual rate of interest of 1% while out of FSHOX

The results of this approach – versus buy-and-hold – appear in Figure 2.2Figure 2 – $1,000 invested in FSHOX using buy-and-hold (red line) versus holding EXCEPT for sitting out “bearish” seasonal period (blue line) (Jan-89-present)

For the record, since 1/3/1989:

*$1,000 invested in ticker FSHOX using buy-and-hold grew to $21,266

*$1,000 invested in ticker FSHOX as described above grew to $72,343

Summary

So should you absolutely, positively sell housing and construction stocks by the 2nd day of June.  Well, as always with seasonal trends, there is no guarantee that the trend highlighted above will occur in 2016.  In fact, the reality is that FSHOX has actually advanced during the “bearish” period highlighted 11 out of 27 years (41% of the time).  So a decline in housing stocks is clearly “no sure thing.”

Still, as a wise old investor once said – well, I am actually paraphrasing here:

“Minus 71% is minus 71%”

Which is worth remembering I think.

Jay Kaeppel


Where NOT to Invest Right Now (Part 1)

I have certainly enjoyed the run up in silver so far this year.  But for reasons that I will explain in a moment, I will be “adjusting my attitude” soon – at least for a little while.  Granted, betting against precious metals when they are in the midst of a strong advance is one of the easiest ways to make yourself look foolish. But the truth is that I have been down that road so many times over the years it is not a fear I concern myself with much anymore.  Also this….

IMPORTANT NOTE:  Please note that the title says “Where NOT to Invest Right Now”.  Note also that it DOES NOT say “Occasionally Foolish Looking Blog Writer Calls a Top in Silver” or even “Sell Short Silver Right Now!”  I am not attempting to “call the top”, nor am I suggesting that anyone play the short side of silver.  I am just saying that I personally will not be buying silver anytime soon.  Nothing more, nothing less.

Why?  I thought you’d never ask.

“Dumb Money / Smart Money”

In the futures market it is sort of accepted wisdom that “non-commercial speculators” (the typical “I better pile into this investment vehicle that has already been soaring price for some time now before it is too late” kind of guy or gal) are the “dumb money” and that “commercial hedgers” (i.e., those who actual use a particular commodity in their business) are the “smart” money.  My experience is that this is not always true, however, it is noteworthy when the two are at opposite extremes.  Um, like now.

As you can see in Figure 1 (chart courtesy of J. Lyons Fund Management, Inc.), “small speculators” have responded to the recent rally in silver by getting wildly bullish (as small speculators will do) while commercial hedgers have responded by selling short a record number of silver futures contracts. 1Figure 1 – Small speculators wildly bullish; Commercial hedgers extremely cautious (Source: J. Lyons Fund Management, Inc.)

Does this mean that “the top is in” for silver, or even that prices are poised to immediately sell off?  Not necessarily.  But here is the question to ask based on the data shown in Figure 1: Who is most likely to be right in this situation?

An Unfavorable Seasonal Trend

Figure 2 below displays the net result that a trader would have “achieved” since 1982 by holding long one silver futures contract every year between:

*The end of May Trading Day #9 and;

*The end of June Trading Day #19

2Figure 2 – Long 1 silver futures contract from May Trading Day 9 through June Trading Day 19 (1982-2015)

For the record:

*This period has seen silver advance in price 8 times (24% of the time)

*This period has seen silver decline in price 26 times (76% of the time)

Again, none of this means that silver will absolutely, positively decline between the close on May 12th, 2016 (May Trading Day #9) and the close on June 25th, 2016 (June Trading Day #16)?  Not at all.  Still, if you had to choose between buying silver now or not buying silver now….

Summary

When the metals markets get going it is typically best to not stand in their way.  They are capable of ignoring a lot of sentiment and fundamental negatives and soar far beyond were many people think they can or should.

Still – one last time:

*I am not attempting to “call the top” in silver (although in the interest of full disclosure, if silver did happen to top out exactly on May 12th chances are I will take credit for doing so anyway – sorry, it’s just my nature)

*I am not presently advocating a short position in silver

I am simply stating that I won’t be adding any bullish positions in silver to my portfolio in the near future.  This is based on the fact that the traditional dumb money is extremely bullish, the traditional smart money is extremely bearish and the seasonal headwinds may be about to blow.

Jay Kaeppel


Sugar Looking Not So Sweet?

OK, I understand that the sugar market is not top of mind for a lot of people.  But if you ate as much of it as I do you would better understand my fixation.  Beyond that, one the keys to success for a trader is to identify potential opportunities wherever they may lie.

A Potential Reversal in Sugar?

A glance at Figure 1 below reveals a classic (potential) “key reversal” pattern for the October 2016 sugar futures contract.  As you can see, sugar has a history of forming multiple tops and/or bottoms and then reversing.1Figure 1  – A potential key reversal in October sugar (Courtesy ProfitSource by HUBB)

In the last several days:

*Price broke out to a new high (for the move) for one day

*Tried to trade higher the next day

*Then collapsed like, um, a rotten tooth(?)

Is this a tradable event?  Some technical analysts might say “yes”, while others might say “no”, or more likely, “maybe”.  Now look at Figure 2 which displays the weekly Elliott Wave count for October sugar as calculated by ProfitSource from HUBB.2igure 2 – Weekly Elliott wave count for October sugar may be setting up bearish (Courtesy ProfitSource by HUBB)

As you can see in Figure 2, the weekly EW count for October sugar is projecting the potential for sharply lower prices if there is a breakout to the downside below the rising blue line.  A word of caution: Elliott Wave counts have a way of shifting over time so this is simply a “projection” based on the current chart configuration, and NOT a prediction.

Summary

So is the seven month rally in sugar over?  Are we headed back down to 10 or 11 cents a pound?  Is now the exact right moment to sell short?

Sorry folks, but I have to go with my stock answer – “it beats me.”

The only thing I do know is that I will be keeping an eye on the weekly chart and if:

*The current Elliott Wave count (i.e., setting up a Wave 4 sell) holds, AND

*October sugar breaks below the rising EW blue line (see Figure 2);

*There may be an opportunity to play the short side in sugar.

Which could be bad news for my teeth….but I digress…..

Jay Kaeppel

Beware the Middle of May

The beginning of the month of May and the end of the month of May into early June have overall been a decent time to be in the stock market.  The middle of May, typically not so much.

For our purposes we will split May (into June) into three segments:

*Segment 1: The first 3 trading days of May (Bullish)

*Segment 2: May trading days #4 through #16 (Bearish)

*Segment 3: May trading day #17 through the 5th trading day of June

Figure 1 displays the growth of $1,000 invested in the Dow Jones Industrials Average only during the first three trading days of May since 1934.1Figure 1 – Growth of $1,000 invested in Dow Industrials during 1st three trading days of May (1934-present)

Figure 2 displays the growth of $1,000 invested in the Dow Jones Industrials Average only during trading days 4 through 16 of May since 1934.2Figure 2 – Growth of $1,000 invested in Dow Industrials during trading days 4 through 16 of May (1934-present)

Figure 3 displays the growth of $1,000 invested in the Dow Jones Industrials Average only from the close of May trading day #16 and the close of the 5th trading day of June.3Figure 3 – Growth of $1,000 invested in Dow Industrials during trading days #17 and higher during May and the 1st five trading days of June  (1934-present)

Combining and Comparing

In Figure 4 the blue line displays the growth of $1,000 invested in the Dow only during Segment #1 and Segment #3.  The red line displays the growth of $1,000 invested in the Dow only during Segment #2.4Figure 4 – Growth of $1,000 during Segments 1 and 3 (blue) versus Segment 2 (red)

*During Segments #1 and #3 the Dow gained +157.5%

*During Segment #2 the Dow lost -51.1%

During 2016:

*Segment #1 extends from the close on 4/29/16 through the close on 5/4/16

*Segment #2 extends from the close on 5/4/16 through the close on 5/23/16

*Segment #3 extends from the close on 5/23/16 through the close on 6/7/16

Summary

So is the Dow sure to gain ground during Segments #1 and 3 and to lose ground during Segment #2?  Not at all.  For the record:

*Segments 1 and 3 combined have gained an average of +1.2% with 65% of years showing a gain and 35% showing a loss

*Segments 2 has lost an average of (-0.8%) with 49% of years showing a gain and 51% showing a loss

So clearly there are no “sure things” being unveiled here.  Still, if the early days of May see the stock market register a meaningful gain it might make sense to avoid jumping on to the band wagon.

At least for another 13 trading days.….

Jay Kaeppel