All posts by admin

Hedging QQQ – Just in Case

I’ve written a few pieces (here and here) that suggest that caution may be in order between now and the end of October.  For the record:

*A lot of people whose commentary I read seem to be suggesting the same thing (from a contrarian point of view this would be deemed “bullish”)

*All of my the trend-following stuff I follow for the stock market is also still bullish

So despite my general misgivings for the most part I have to respect the current trend.  Given all of this, it would seem like it is not a good time to hedge against a stock market decline….

….Which of course – markets being what they are – is often the very best time to hedge against a stock market decline.

So let’s look at one of my favorite strategies for hedging against a market decline.

The OTM Butterfly Spread

I first learned the “Out-of-the-Money Butterfly Spread” as “The Garbage Trade” from Gustavo Guzman who I used to work with at Optionetics.  The idea is to spend “a couple of bucks” to hedge against an extremely adverse event.  So let’s look at a current example using put options on ticker QQQ – the ETF that tracks the Nasdaq 100 Index.

(Option traders: If you want to use the option trading software that I use please see the 50% discount offer for JayOnTheMarkets.com readers by clicking here)

The example trade in mind goes as follows:

*Buy 30 QQQ December 112 puts

*Sell 60 QQQ December 107 puts

*Buy 30 QQQ December 102 puts

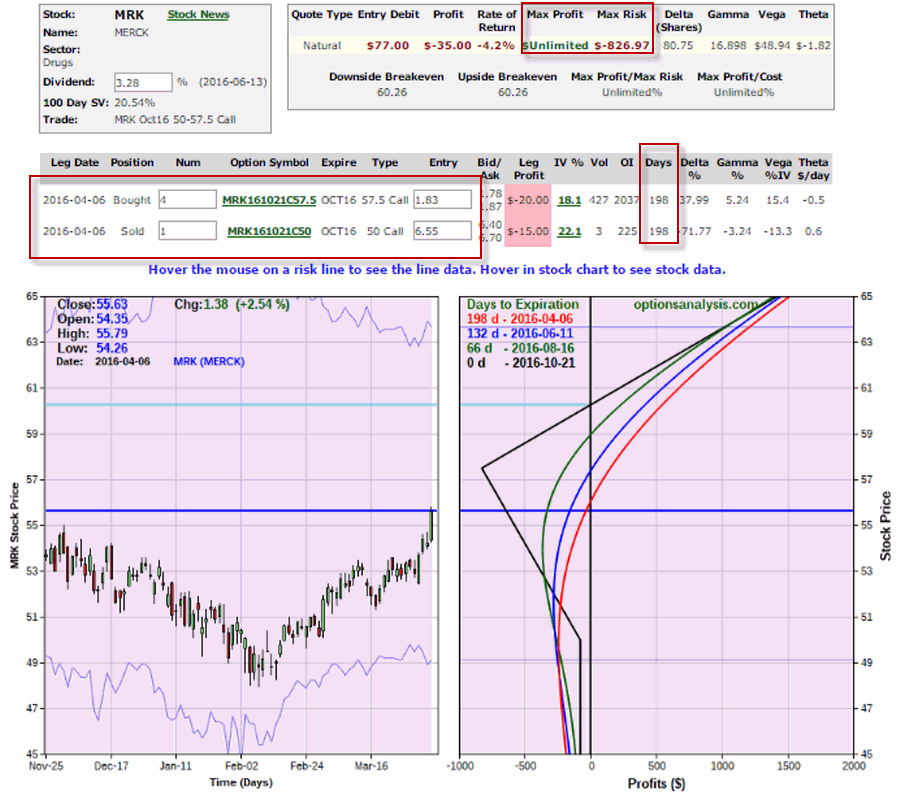
Figure 1 displays the particulars for this trade.1
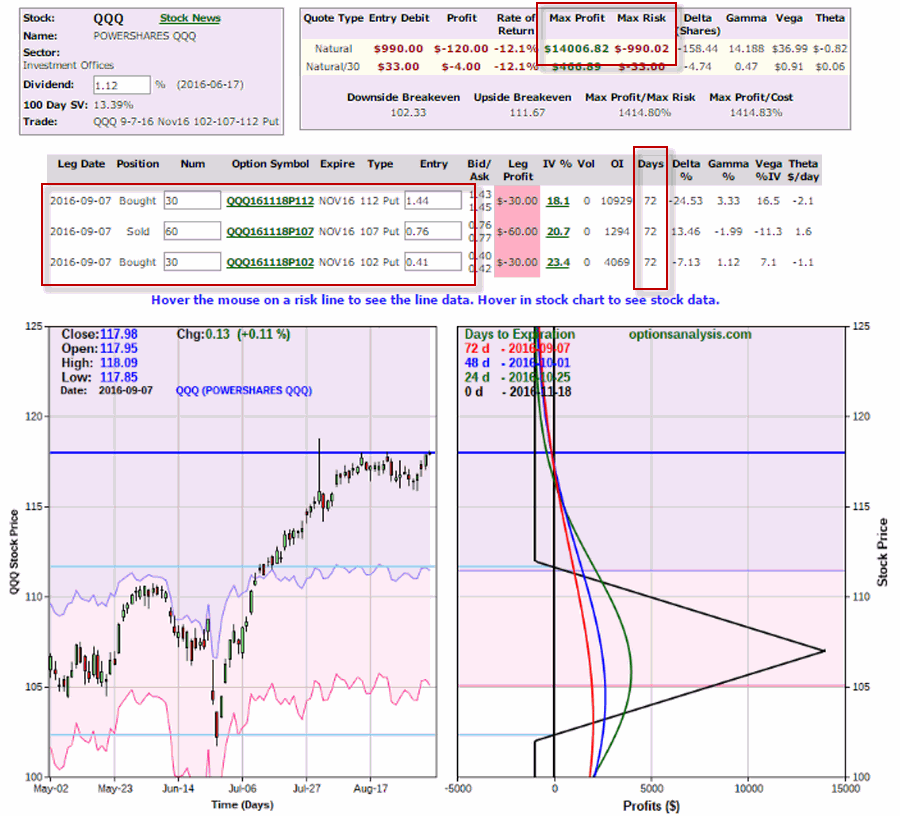
Figure 1 – December QQQ OTM Butterfly Hedge (Courtesy www.OptionsAnalysis.com)

A few notes:

*We purposely chose to use November options so that we could hold the position (if desired) through the end of October.

*The maximum risk is $990 and the maximum profit it $14,006.  However, this maximum profit would only be realized if this trade was held until November expiration and QQQ on that date closed at exactly $107 a share.

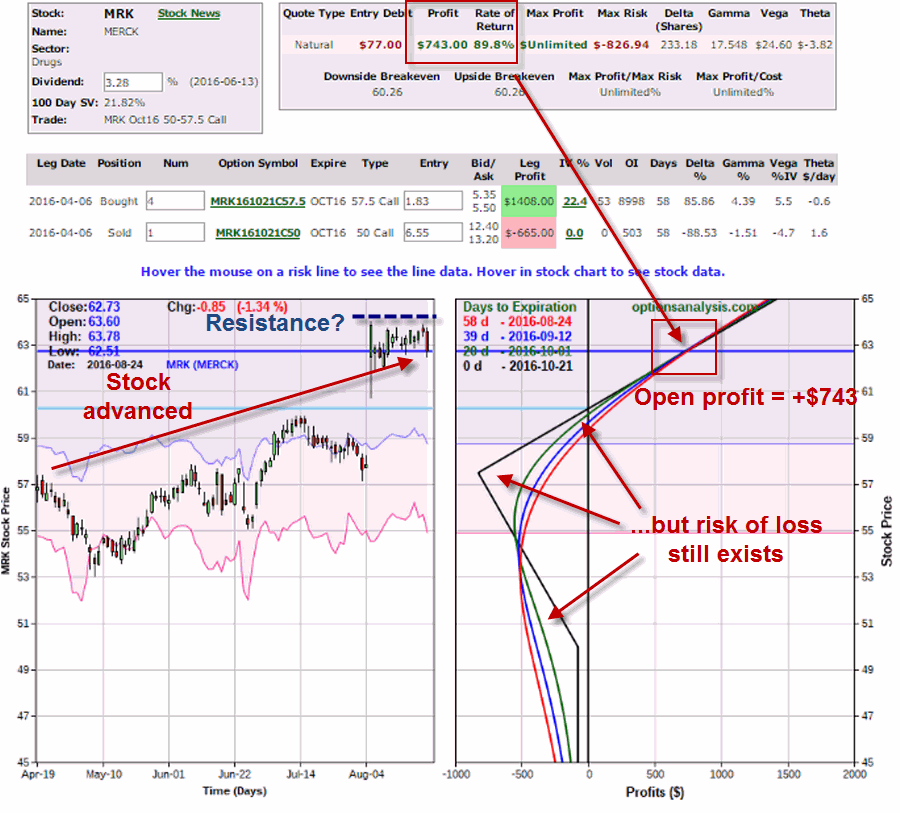
So let’s take a closer look at “where this trade really lives”.

*Specifically, what kind of profit or loss will this hypothetical position generate between now and the end of October is QQQ rallies to a new high, or breaks down 2 full standard deviations in price.

The answers to these questions appear in Figures 2 and 3.

*The top price on the chart is $121 a share for QQQ (which would represent a breakout to new highs)

*The bottom price on the chart is $105 a share for QQQ (which would represent a 2 standard deviation move down)

*The purple line risk curve represents the expected return as of 10/31/2016 (i.e., 18 days prior to November option expiration)2Figure 2 – December QQQ OTM Butterfly Hedge (Courtesy www.OptionsAnalysis.com)

3
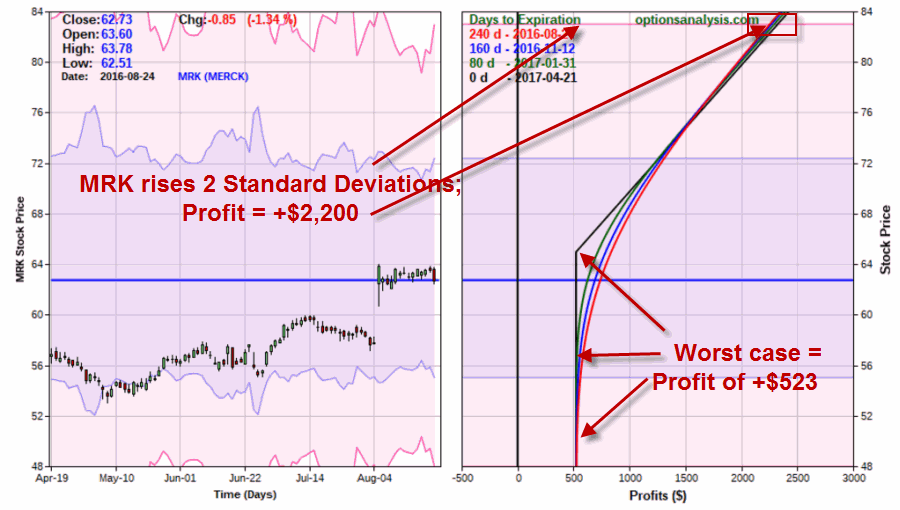
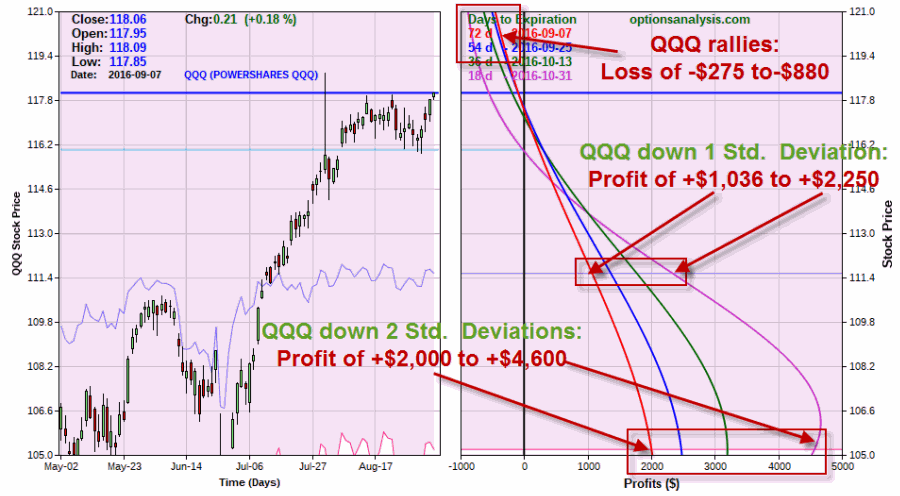
Figure 3 – December QQQ OTM Butterfly Hedge (Courtesy www.OptionsAnalysis.com)

A few notes:

*If QQQ breaks out to new high then a loss of between roughly -$275 (if price breaks out sooner than later and we decide to cut our loss) and -$880 (if we decide to hold on until the end of October

*If QQQ breaks 1 standard deviation to roughly $111.74, this trade would generate a profit of $1,036 to $2,250, depending on how soon that price is hit.

*If QQQ breaks 2 standard deviations to roughly $105.32, this trade would generate a profit of $2,000 to $4,600, depending on how soon that price is hit.

From a “position management” point of view it should be noted that if QQQ drops below $107, the risks curves start to “roll over” and profits become smaller.  So a person holding this position must stand ready to take a profit or adjust the trade if in fact QQQ breaks down hard.

(Option traders: If you want to use the option trading software that I use please see the 50% discount offer to JayOnTheMarkets.com readers by clicking here)

Summary

Should you rush out and enter this trade?  Not necessarily.  Particularly if you are new to options trading.  The  position discussed here is n “example” and not a “recommendation.” The real point here is not to “recommend” this particular trade but rather to open your eyes to a relatively simply and relatively inexpensive, limited risk way to hedge against potentially adverse events.

Just, you know, in case.

Jay Kaeppel


Tortoise v. Hare in September/October

I wrote recently on this blog about the fact that the stock market often exhibits a “split personality” during the month of September.

Please click on this link to read – The Perilous September/October Period by Jay Kaeppel – in which I write about the interesting (OK, granted that my definition of “interesting” may be different than a lot of other people’s) comparative performance of intermediate-term treasuries (starring as “The Tortoise”) versus that of the S&P 500 Index (starring as “The Hare”) during the combined September/October period.

As a tease, consider that during September/October combined, since 1981 the S&P 500 index has:

*Showed a gain 69% of the time

*Outperformed intermediate-term treasuries 60% of the time

*Showed a median gain of +1.35% (which is slightly higher than the +1.34% median gain for intermediate-term treasuries)

So clearly it would seem that stocks have outperformed bonds, right?  What, you never read “The Tortoise vs. the Hare?”

Despite the facts listed above, intermediate treasuries have won the race to the finish by a very wide margin.  Want to know why?  Please read The Perilous September/October Period by Jay Kaeppel.

Jay Kaeppel


The Jekyll and Hyde of September

The month of September is the only calendar that has seen more down months than up month for the stock market.  Using the S&P 500 Index since 1950, there have been 29 “up” Septembers and 37 “down” Septembers, with an average loss of -0.68%.

All told, 44% of the time September has been up and 56% of the time it has been down.  So to imply that September of 2016 is “doomed to be a downer” is hardly accurate.  Still, a closer look at the “internals” for September suggests that investors might consider using more caution as the month progresses.

A Tale of Two Time Periods

For our purposes we will break the month of September into two periods:

*All the days prior to the last 13 trading days of the month

*The last 13 trading days of the month

Figure 1 displays the growth of $1,000 invested in the Dow Jones Industrials Average only during the two periods listed above.  The red line displays the growth (er, decline) during the last 13 trading day of September and the blue line displays the growth of all trading days prior to the last 13 trading days.1Figure 1 – Growth of $1,000 invested in Dow Industrials during the last 13 trading days of September (red line) versus all prior days of month (blue line); 1955-2015

Clearly the last 13 trading days of September has not been the time to expect great things from the stock market.  Figure 2 displays some of the particulars and Figure 3 displays the year-by-year results for the two time periods.

Measure All prior days Last 13 days
# Times UP 33 22
# Times DOWN 28 39
% times UP 54% 36%
% times DOWN 46% 64%
Average % +(-) +0.24% (-1.26%)
Median % +(-) +0.37% (-0.90%)
Standard Deviation 2.14% 3.31%
Largest % Gain +5.3% 6.9%
Largest % Loss (-5.6%) (-11.8%)
# times UP 3% or more 6 3
# times DOWN 3% or more 4 12

Figure 2 – Relative Performance

Things to note regarding the last 13 trading days of September:

*This period showed a loss 64% of the time

*The largest losses were -11.8% (2001) and -11.5% (2002)

*Gains of +3% or greater occurred 3 times

*Loss of -3% or greater occurred 12 times

Figure 3 displays the year-by-year results for both periods since 1955

  Before Last 13
Year Last 13 TDM
9/30/1955 2.72 (2.98)
9/28/1956 0.02 (5.36)
9/30/1957 (2.05) (3.82)
9/30/1958 2.32 2.24
9/30/1959 (4.07) (0.89)
9/30/1960 (2.27) (5.17)
9/29/1961 0.37 (2.96)
9/28/1962 (0.85) (4.14)
9/30/1963 1.51 (1.02)
9/30/1964 3.42 0.95
9/30/1965 3.11 1.05
9/30/1966 0.90 (2.67)
9/29/1967 1.16 1.64
9/30/1968 2.82 1.58
9/30/1969 (1.31) (1.54)
9/30/1970 (0.36) (0.15)
9/30/1971 1.26 (2.44)
9/29/1972 (1.84) 0.76
9/28/1973 (0.20) 6.93
9/30/1974 (3.52) (7.16)
9/30/1975 (2.72) (2.31)
9/30/1976 0.98 0.70
9/30/1977 (0.80) (0.87)
9/29/1978 3.38 (4.48)
9/28/1979 (2.02) 1.02
9/30/1980 0.93 (0.94)
9/30/1981 (0.98) (2.62)
9/30/1982 1.93 (2.44)
9/30/1983 0.65 0.74
9/28/1984 (2.16) 0.73
9/30/1985 (0.04) (0.36)
9/30/1986 (5.55) (1.41)
9/30/1987 (2.04) (0.48)
9/30/1988 2.53 1.43
9/29/1989 (1.10) (0.53)
9/28/1990 (0.07) (6.13)
9/30/1991 (1.86) 0.99
9/30/1992 1.48 (1.03)
9/30/1993 (0.47) (2.18)
9/30/1994 (0.86) (0.95)
9/29/1995 2.96 0.88
9/30/1996 2.47 2.21
9/30/1997 0.51 3.71
9/30/1998 3.40 0.60
9/30/1999 1.86 (6.29)
9/29/2000 0.16 (5.18)
9/28/2001 0.84 (11.82)
9/30/2002 (0.95) (11.53)
9/30/2003 0.47 (1.95)
9/30/2004 1.38 (2.27)
9/30/2005 1.11 (0.27)
9/29/2006 1.03 1.57
9/28/2007 (0.37) 4.41
9/30/2008 (0.95) (5.10)
9/30/2009 1.15 1.11
9/30/2010 5.29 2.31
9/30/2011 (4.37) (1.73)
9/28/2012 1.78 0.85
9/30/2013 3.49 (1.28)
9/30/2014 (0.29) (0.04)
9/30/2015 (0.57) (0.90)

Figure 3 – Year-by-Year Results for September

Summary

The numbers presented here paint a grim picture regarding the latter portion of the month of September.  Still the reality is that each year is a new roll of the dice (and remember that in 1973 the last 13 days of September witnessed a gain of +6.9%).

In the end the results presented here merely suggest that investors and traders who are nervous about their holdings and/or are willing to consider hedging might look to take some precautionary action by the close of trading on 9/13/16.

 Jay Kaeppel

The Beauty of Locking in a Profit

In this article dated April 7, 2016, I wrote about a hypothetical option trading opportunity in MRK.  The gist of the idea was to “risk a little, in hopes of making a lot.”  Unlike many option trades that focus on using short-term options, this one used call options with over 6 months left until expiration – in order to give MRK a lot of time to stage some sort of move.

Well MRK moved and the time to “do something” appears to be at hand.

Figure 1 displays the initial trade and the initial risk/reward outlook.1Figure 1 – Initial MRK call backspread trade (Courtesy www.OptionsAnalysis.com)

Figure 2 displays the initial trade as of the close on 8/24.  As you can see, MRK stock advanced from$55.63 to $62.73 and the option trade was sitting with an open profit of $743 (+89.8%). 2Figure 2 – MRK call backspread as of 8/24 (Courtesy www.OptionsAnalysis.com)

The good news is that this trade has a nice percentage profit and retains further upside potential.  The bad news is that the trade could easily turn back into a loser if MRK stock backs off from here.  On 8/23 MRK failed to break out to the upside and the next day fell back hard.

So let’s consider a simple adjustment to lock in a profit while still allowing for further upside potential.

The Adjustment

The truth is that there are an endless number of ways to adjust any option trade.  The choice should be based on one’s outlook going forward for the underlying security in question.  In this case, I have no real opinion one way or the other regarding where MRK is heading next.  But I do know that I do not want to see the current open profit vanish, and I am willing to give MRK the opportunity to move higher still. As a result, the adjustment below involves:

*Buying 1 Oct2016 MRK 50 strike price call

*Selling 4 Oct2016 MRK 50 strike price calls

*Buying 1 Apr2017 MRK 65 strike price call

This adjustment simply exits the original trade and buys a single long call option that can allow us to make more if MRK does in fact move higher between now and April 2017 expiration (240 days from now).  The risk curves appear in Figure 3.3Figure 3 – Adjusted MRK trade (now long Apr2017 65 strike price call) (Courtesy www.OptionsAnalysis.com)

Things to note:

*This adjusted trade locks in a minimum profit of $523 if MRK is at $65 a share or below 240 days from now.

*The upside potential remains unlimited.

*If MRK rise 2 standard deviations (to roughly $83 a share, the profit can swell to $2,200 or more.

*If MRK collapses the worst case is still a locked in profit of $523.

Summary

One advantage to trading options is the ability to adjust your initial position in order to obtain a more favorable reward-to-risk ratio.  Hopefully this MRK example makes that assertion a little easier to understand.

Jay Kaeppel


The 3 Days of the Month to Avoid

Some days are just better than others – am I right or am I right?  As a corollary, some days are worse than others.  Wouldn’t it be nice to know in advance which days were going to be which?

Well, when it comes to the stock market (and bond market for that matter), maybe you can.

The 3 Days to Miss

For our purposes we will refer to the very last trading day of the month as TDM -1.  The day before that will be TDM -2, the one before that TDM -3, etc.  Now let’s focus specifically on TDMs -7, -6 and -5.

(See also The World is Your Oyster – 11 Days a Month)

Let’s now assume that we will buy and hold the Dow Jones Industrials Average every day of every month EXCEPT for those three days – i.e., we will sell at the close of TDM -8 every single month and buy back in 3 days later.  We will refer to this as Jay’s -765 Method.  Granted some may not be comfortable trading this often, but before dismissing the idea please consider the results.

Figure 1 displays the growth of $1,000 invested in the Dow as described above versus the growth of $1,000 from buying and holding the Dow.

*The starting date for this test is 12/1/1933.

*For this test no interest is assumed on the 3 days a month spent out of the market.1Figure 1 – Growth of $1,000 invested in Dow Industrials during all days EXCEPT TDM -7,TDM -6 and TDM -5 (blue line) versus $1,000 invested in Dow Industrials using buy-and-hold (red line); 12/1/1933-8/15/2016

For the record:

*Jay’s -765 Method gained +94,190%

*The Dow buy-and-hold gained +18,745%

While these results are compelling, the real “Wow” comes from looking at would have happened if you had been long the Dow ONLY on TDMs -7,-6 and -5 every month since 1933.  These results appear in Figure 2 (but you’d better brace yourself before taking a glance).2Figure 2 – Growth of $1,000 invested in the Dow ONLY on the 7th to last, 6th to last and 5th to last trading days of every month since 12/1/1933

The net result is an almost unrelenting 83 year decline of -80%.

Summary

I would guess that some readers would like me to offer a detailed and logical reason as to why this works.  Unfortunately, I will have to go with my stock answer of “It beats me.”  Of course, as a proud graduate of “The School of Whatever Works” (Team Cheer: “Whatever!”) I am not as interested in the “Why” of things as I am the “How Much.”

Sorry, it’s just my nature.

Jay Kaeppel


Seasonal Bonds Strategy Bounces Back

I hate to whine but Murphy (of Murphy’s Law fame) really hates me.  To wit, on 3/11/15, I wrote about a very pronounced tendency for t-bonds to rise during the last 5 trading days of the month (and to basically suck wind the rest of the time).

On 3/15/15 I wrote about an even more aggressive strategy using triple-leveraged ticker TMF that tracks long-term t-bonds using leverage of 3-to-1.

So of course the bond market rewarded my “brilliance” with a swift kick in the you know where in the months of March and April 2015 and especially in August 2015.

This would typically be enough to cause many people to go, “Well that guy’s and idiot” and to move on.  But fortunately in this case, the market is a marathon and not a sprint.

Update

Figure 1 displays the results generated by:

*Holding long 1 t-bond futures contract ONLY for the last 5 days of each month since 12/30/1983

*Holding long 1 t-bond futures contract during all other days since 12/30/19831Figure 1 – Long 1 t-bond futures contract ONLY during last 5 trading days of month (blue) versus long 1 t-bond futures contract on all other days  (red); 12/31/1983-8/12/2016

The results sort of speak for themselves.

After I wrote about my aggressive TMF strategy, TMF (of course) got hit very hard (as triple leveraged ETFs will do from time to time, hence the use of the words “aggressive” and “risky”), in March 2015 (-4.5%), April 2015 (-5.3%) and especially in August 2015 (-11.5%).

Still, as you can see in Figure 2, things have rebounded nicely since (hmmm, maybe I should be worried).2Figure 2– Growth of $1,000 Long ETF ticker TMF ONLY during last 5 trading days of month (blue) versus long TMF all other days; (red); 12/9/2009-8/12/2016

So far the “Long TMF on the last 5 day of each month” strategy is up +31.8% for the year in 2016.

Year Last 5 TDM Long TMF
2009* +12.9%
2010 +33.4%
2011 +15.2%
2012 +35.7%
2013 +6.7%
2014 +45.7%
2015 +6.8%
2016** +31.8%

*-Starting 4/16/2009 when TMF started trading

**-Through 8/12/2016

Summary

So did this odd little strategy “weather the storm” and “take the market’s best shot” in 2015 and now it is “smooth sailing”?  Probably not.  Make no mistake – this is a strategy that entails a great deal of risk.  Still, for aggressive traders looking for an “edge”, it might be worth a closer look.

Jay Kaeppel


Hedging Risk Away with Ticker TZA

It pains me to say that I don’t know where the stock market is going next.  You would think that after being in the markets for so long and following a bunch of indicators and systems etc., that by now I would have developed some ability to divine what is coming next.

Alas, I have not.

But I do know three things:

*My trend-following stuff is bullish so I need to give the bullish case the benefit of the doubt (no matter how nervous or cynical I may be).

*Based on a variety of indicators the market is certainly getting overbought

*Based on the calendar, some caution may be in order

So, a thought today for those who might be wishing to hedge away some of their market risk.

Ticker TZA

Ticker TZA is not necessarily one of my favorites.  It is an ETF that tracks 3 times the inverse of the Russell 2000 small-cap     index. In other words, if ticker RUT falls 1% today then TZA should rise 3%.  There are two primary concerns to keep in mind before considering buying shares of TZA are:

*The shares are extremely volatile

*The shares have experienced a serious downside bias – even when RUT is headed sideways (See Figure 1).1Figure 1 – Ticker TZA (black bars) versus Ticker RUT (Russell 2000) (Courtesy AIQ TradingExpert)

So if you are going to buy TZA you’d better pick your spots. As I discussed here we are entering an “interesting” time for the market.  So let’s explore the possibility of buying a call option on ticker TZA as a hedge against a potential market decline.

Call Option on TZA

Remember, TZA should increase in value if the Russell 2000 declines.  Therefore, a call option on TZA should also increase in value if the Russell 2000 declines.

As you can see in Figure 2, the “implied volatility” (which generally tells you whether there is a lot of time premium built into the price of the options for a given security) for options on TZA is near the low end of the historical range.  This tells us that there is relatively little time premium built into TZA options, therefore they are “cheap”.2Figure 2 – Implied option volatility for options on TA near the low end of the historical range (Courtesy www.OptionsAnalysis.com)

Next I ran the “Percent to Double” routine in www.OptionsAnalysis.com (see output in Figure 3.  The phrase “percent to double” tells us what percentage the underlying stock must rise in order for the call option to double in price.3Figure 3 – Percent to Double routine suggests buying Sep30 TZA call which will double in price if TZA rises 12.56% (i.e., if RUT declines by roughly -4.19%) (Courtesy www.OptionsAnalysis.com)

Figures 4 and 5 display the particulars and risk curves for buying 10 TZA Sep 30 calls.

4Figure 4 – TZA Sep30 details (Courtesy www.OptionsAnalysis.com)5Figure 5 – TZA Sep30 risk curves (Courtesy www.OptionsAnalysis.com)

A few things to note:

*The cost to buy 10 is $2,550.

*TZA is trading at $30.25/share.

*The breakeven price for this trade is $32.25 (if TZA is below $32.25 at expiration and we still hold this position then we will lose -$2,250)

*There are 50 days left until September expiration

*The trade has unlimited profit potential

Regarding potential, in Figure 6 we see that if TZA rallies back to its June low of $33.77 this trade will generate a profit of between $1,500 and $2,400 depending on how soon  that price is reached.6Figure 6 – A potential 1st profit target for TZA hedge (Courtesy www.OptionsAnalysis.com)

Summary

Is this a good trade?  I can’t say for sure that it is.  In fact, the only way this trade makes money is if the broader market suffers a hit, so a good part of me would prefer to see this trade “not work out”.

But the point of all of this is simply to point out that it is possible to hedge against a significant market decline by buying call options on an inverse leveraged ETF.

Mr. Market, you take it from here.

Jay Kaeppel

August/September – Play it Safe or Swing for the Fences?

We are entering an “interesting” time of year for investors (Unfortunately, that’s “Interesting” as in the ancient Chinese curse stating “May you live in interesting times”).

Now I personally I have no idea if the stock market is going to break out to the upside and rally to further new highs or if this latest lull will be followed by a painful reversal of fortune.  I am willing to play the long side as long as things are holding up/moving in the right direction.  But investors should be aware that the August/September timeframe is the “Danger Zone” for the stock market historically.

August/September Historically

Figure 1 speaks for itself.  The chart displays the growth of $1000 invested in the Dow Jones Industrials Average only during the months of August and September every year starting in1934.1Figure 1 – Growth of $1,000 invested in Dow Jones Industrials Average (using price data only) ONLY during August and September; 12/31/1933-present

Two key takeaways:

*The net result has been a loss of -53% or the past 82 year.  Not exactly the kind of returns most of us are looking for.

HOWEVER

*Despite the negative net results, the fact is that the Aug/Sep period has showed a gain more often (45 times) than not (37 times).

So while caution appears to be in order, no one should assume that the next two months are doomed to show a loss.

Stocks versus Bonds

Figure 2 compares the performance of:

Ticker VFINX – Vanguard S&P 500 Index fund

*Ticker VFIIX – Vanguard Mortgage Bond Fund

(*VFIIX is used as a proxy for intermediate-term treasuries as it has a high correlation to IT treasuries and a longer data history.  Any short-to-intermediate term treasury fund or ETF would likely produce similar results)

The test starts in 1980 (when VFIIX started trading) and shows the total return for buying and holding each fund ONLY during the months of August and September each year since.

2Figure 2 – Growth of $1,000 invested in VFINX (stocks; blue line) versus VFIIX (bonds; red line); August 1980 to present

Summary

So what will it be this year?  A breakout to new highs?  Or something much worse?  I wish I could tell you the answer.  But at least now you have some information to help guide your “speculative” versus “conservative” instincts in the months ahead.

Jay Kaeppel

An Excellent Review of the Basics of the Double Bottom

Even experienced investors and traders can benefit from reviewing the basics once in awhile.  The link below leads to an article posted by Charles Schwab & Co.  that discusses the “double bottom” formation.

Finessing The Double Bottom from Charles Schwab & Co.

The double bottom is one of the most useful formations that a trader can learn about (in my opinion).  This formation:

A) Can be applied to any security (stocks/bonds/index/commodities/FOREX/ETFs/etc)

B) Tells you when a reversal of fortune may be imminent

C) Provides a built in stop loss level (i.e., below the recent low)

If you are into markets, trading, chart patterns, or just making money in general, I suggest you click the link and learn – or revisit – the basics of the double bottom.

Finessing The Double Bottom from Charles Schwab & Co.

Jay Kaeppel

The Evolution of a Silver Trade

Allow me to be candid.  If you have no interest in option trading there is a very high likelihood that you will not enjoy this article.  So while I will encourage you to “take a chance” and keep reading, if it “ain’t your cup of tea”, then “class dismissed”.  Thanks for stopping by and please check back soon.

If you are into option trading then settle in and get ready to learn a lesson in using the power of options to create a trade with unlimited potential and limited risk – and to then adjust that position to improve the odds of success and to lock in a profit, thereby reducing stress.

(See also Can Junk Bonds Overcome Unfavorable Seasonal Bias?)

Trade #1

The initial trade was found on 6/3 using the “SkewFinder” routine at www.OptionsAnalysis.com and was based on a bullish outlook for silver.  The initial trade involved:

*Buying 11 Sep16 SLV 15 calls

*Selling 11 Jan17 SLV 20 calls

(click to enlarge)1Figure 1 – Initial SLV Sep15/Jan20 call spread (Courtesy www.OptionsAnalysis.com)

Adjustment #1

By 6/13 the initial trade had generated an open profit of $506 and shown in Figure 2.

(click to enlarge)2Figure 2 – A decent profit, but still risk of loss (Courtesy www.OptionsAnalysis.com)

At this point the decision was made to adjust the trade in order to eliminate the risk of loss, i.e., to lock in a profit.  That trade involved:

*Selling 11 Sep16 SLV 15 calls

*Buying 10 Jan17 SLV 20 calls

*Buying 2 Jan17 18 calls

The particulars and risk curves for this trade appear in Figure 3.  Note that the worst case now is a profit of $306.

(click to enlarge)3Figure 3 – SLV trade after 1st adjustment (Courtesy www.OptionsAnalysis.com)

Adjustment #2

After another upleg, SLV reversed to the downside on 7/12.  At this point the decision was made to make another adjustment.  This adjustment involved:

*Selling 2 Jan17 18 calls

*Buying 2 Jan17 20 calls

*Buying 1 Jan17 15 put

The net effect of this adjustment was to:

*Lock in additional profit

*Retain upside potential

*Create the potential for profit if SLV falls apart

See Figure 4 (click to enlarge)4Figure 4 – Adjusted trade as of 7/12 (Courtesy www.OptionsAnalysis.com)

Summary

When it comes to option trading the bottom line is that there are a lot of ways to play.  The more one learns and the more comfortable one becomes the greater the potential for entering into limited risk trades – and adjusting those trades to reduce risk, lock in profit and/or otherwise improves one’s reward-to-risk scenario.

Jay Kaeppel