In this article I wrote about financial stock performance across the typical four-year election cycle. To make a long story short, using ticker FSRBX as a proxy for the sector there appear to be four “favorable” periods within the election cycle.
The last of those four begins on July 1st and ends December 31st.
Please DO NOT confuse that statement with me shouting “BUY FINANCIAL STOCKS NOW!” In fact, I am not “predicting” anything. As always, one can come up with plenty of good reasons NOT to do that right now. Nothing – especially when it comes to seasonality in the stock market – is ever “guaranteed”. But just a quick review.
A Quick Review
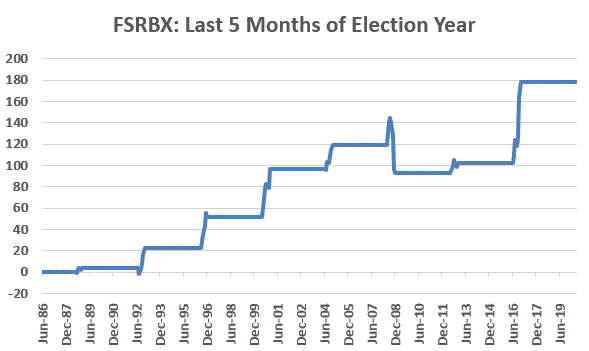
Figure 1 displays the total return for FSRBX ONLY during the months of July through December of each presidential election year since fund inception in 1986.

Figure 1 – Cumulative Return for FSRBX during July through December of Election Years; 1986-2020
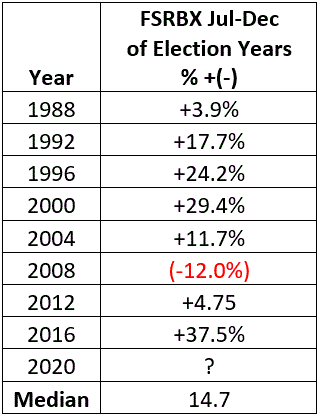
Figure 2 displays the cumulative return on an election year by election year basis.

Figure 2 – FSRBX during Jul-Dec of Election Years; 1986-2020
Summary
There is plenty of negative sentiment out there regarding financial stocks. But historically the months directly ahead have been favorable for this sector. Investors willing to buck the crowd might consider giving financial stocks the benefit of the doubt in the months ahead.
See also Jay Kaeppel Interview in July 2020 issue of Technical Analysis of Stocks and Commodities magazine
See also Jay’s “A Strategy You Probably Haven’t Considered” Video
See also Video – The Long-Term…Now More Important Than Ever
Jay Kaeppel
Disclaimer: The information, opinions and ideas expressed herein are for informational and educational purposes only and are based on research conducted and presented solely by the author. The information presented represents the views of the author only and does not constitute a complete description of any investment service. In addition, nothing presented herein should be construed as investment advice, as an advertisement or offering of investment advisory services, or as an offer to sell or a solicitation to buy any security. The data presented herein were obtained from various third-party sources. While the data is believed to be reliable, no representation is made as to, and no responsibility, warranty or liability is accepted for the accuracy or completeness of such information. International investments are subject to additional risks such as currency fluctuations, political instability and the potential for illiquid markets. Past performance is no guarantee of future results. There is risk of loss in all trading. Back tested performance does not represent actual performance and should not be interpreted as an indication of such performance. Also, back tested performance results have certain inherent limitations and differs from actual performance because it is achieved with the benefit of hindsight.


Dear Jay. Thanks your your blog, it is full of gems.
I have run your strategy about Combining Two Seasonal Strategies into One in portfolio123 with ETFs. I cannot get the same results than you. I would like to know if there is anything I am missing. I could share with you all the transactions.
Best regards
Rafael, I have not worked with portfolio123 so not sure what they use. the results in the article used monthly total return data (from a source believed to be reliable) for the Fidelity Funds listed, not the ETFs. Again, not sure what portfolio123 uses but historical data can get “interesting”. For example, if you download daily data from say http://www.finance.yahoo.com it is important to base any testing on “Adjusted Close” price and not “Close” price as adjusted close (purports) to emulate total return data. Not sure if any of that helps, but again I have a source that reports monthly total return data and I use that – NOT daily price or even adjusted price data. Take Care, Jay