Thanks for the genesis of the idea contained in this piece goes to alert reader “James”, who included a comment (“International and emerging has tended to outperform U.S. S&P 500, and vice versa, when 3 year annual rolling returns were “greater” than.”) at the end of this article.
The idea is that momentum can be useful in deciding whether to invest in the domestic U.S. or internationally (for the record, it does NOT necessarily need to be an either/or proposition, but we will make it so for the purposes of this piece).
(NOTE: Please keep your eyes peeled for the July 2020 issue of Technical Analysis of Stocks & Commodities – due out around June 11 – which will feature an interview with yours truly).
Data Used
*S&P 500 Index monthly total return
*MSCI EAFE Index monthly total return
*January 1975 through April 2020
Part 1: Measuring Momentum
For our momentum measure we will use the 36-month % gain or loss for the S&P 500 Index (SPX) and the MSCI EAFE Index (EAFE). In a nutshell:
*If the latest 36-month period has showed a bigger gain for SPX then hold SPX next month
*If the latest 36-month period has showed a bigger gain for EAFE then hold EAFE next month
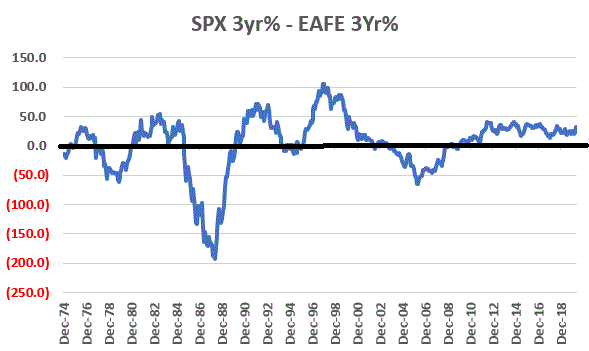
Figure 1 displays the SPX 36-month change and EAFE 36-month change. Readings above 0 favor U.S. stocks, readings below 0 favor international stocks.

Figure 1 – U.S. Stocks (SPX) 36-month return minus International Stocks (EAFE) 36-month return; 1974-2020
NOTE: I am using monthly total return data, which is not compiled until early in the next month. So, for strategy performance results I use a 1-month lag as follows – the calculation for the end of January actually takes place sometime in early February, so if a switch from one index to the other is indicated based on data through January then that trade is made at the close of the last trading day of February.
Initial results
As a benchmark we will using a “split” strategy that allocated 50% to SPX and 50% to EAFE at the first of every year. We will refer to this as “Split”.
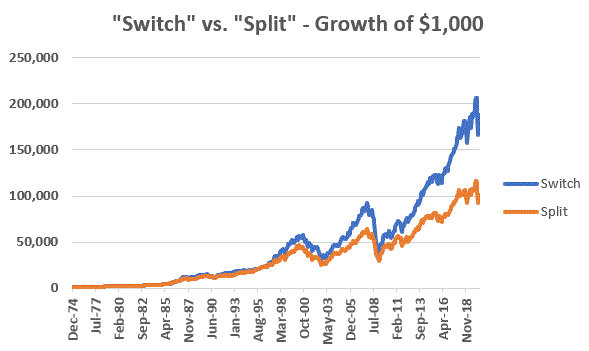
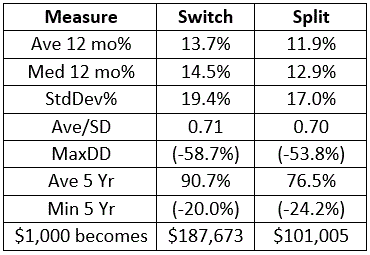
Figure 2 displays the comparative growth of $1,000. Figure 3 displays comparative facts and figures.

Figure 2 – Growth of $1,000 using “Switch” strategy versus “Split” strategy (1975-2020)

Figure 3 – Comparative Facts and Figures: Switch versus split (1975-2020)
Good News and Bad News
The good news is that the Switch strategy significantly outperformed the Split strategy over time (+18,667% versus +10,001%)
The bad news is that the Switch strategy is extremely volatile (a 12-month standard deviation of 19.4% versus 17.0% for the Split strategy) and suffered a substantial drawdown of -58.7% (during the 2007-2009 bear market), which was even larger than the -53.8% drawdown suffered by the Split strategy.
Summary
For the not too faint of heart there does appear to be a potentially significant long-term benefit to switching between U.S. and international stocks based on a 3-year rate-of-change momentum. Still, the volatility and drawdowns may give some investors pause (justifiably so).
Is there a way to improve upon the initial results? Would I ask the question if the answer was “No?”
Stay tuned for Part II.
See also Jay’s “A Strategy You Probably Haven’t Considered” Video
See also Video – The Long-Term…Now More Important Than Ever
Jay Kaeppel
Disclaimer: The information, opinions and ideas expressed herein are for informational and educational purposes only and are based on research conducted and presented solely by the author. The information presented represents the views of the author only and does not constitute a complete description of any investment service. In addition, nothing presented herein should be construed as investment advice, as an advertisement or offering of investment advisory services, or as an offer to sell or a solicitation to buy any security. The data presented herein were obtained from various third-party sources. While the data is believed to be reliable, no representation is made as to, and no responsibility, warranty or liability is accepted for the accuracy or completeness of such information. International investments are subject to additional risks such as currency fluctuations, political instability and the potential for illiquid markets. Past performance is no guarantee of future results. There is risk of loss in all trading. Back tested performance does not represent actual performance and should not be interpreted as an indication of such performance. Also, back tested performance results have certain inherent limitations and differs from actual performance because it is achieved with the benefit of hindsight.

