To say that there is has been and remains a great deal of angst in the financial markets is a bit of an understatement. This is especially true when it comes to the financial sector. The financial sector has a fairly high correlation to treasury yields (ticker FSRBX – Fidelity Select Banking Portfolio has a 0.52 correlation to ticker TNX – which tracks 10-year treasury yields). As yields have plummeted so has the financial sector. During the recent decline, FSRBX plunged -51% from its December 2019 peak. With little expectation of higher rates anytime soon a lot of investors are understandably wary of diving into this sector.
But much like with the energy sector, the old adage that the time to buy is when there is “blood in the streets”, should give one pause before they turn their back completely on the financial sector. For the time being I am keeping my eye on a little-known indicator called “Vixfixaverageave” (yes, I agree it is a really bad name). The calculations for this indicator appear at the end of this article. The reason I am watching it right now is that it recently reached a very oversold level that has helped to highlight some useful buying opportunities for financials in the past.
Ticker FSRBX
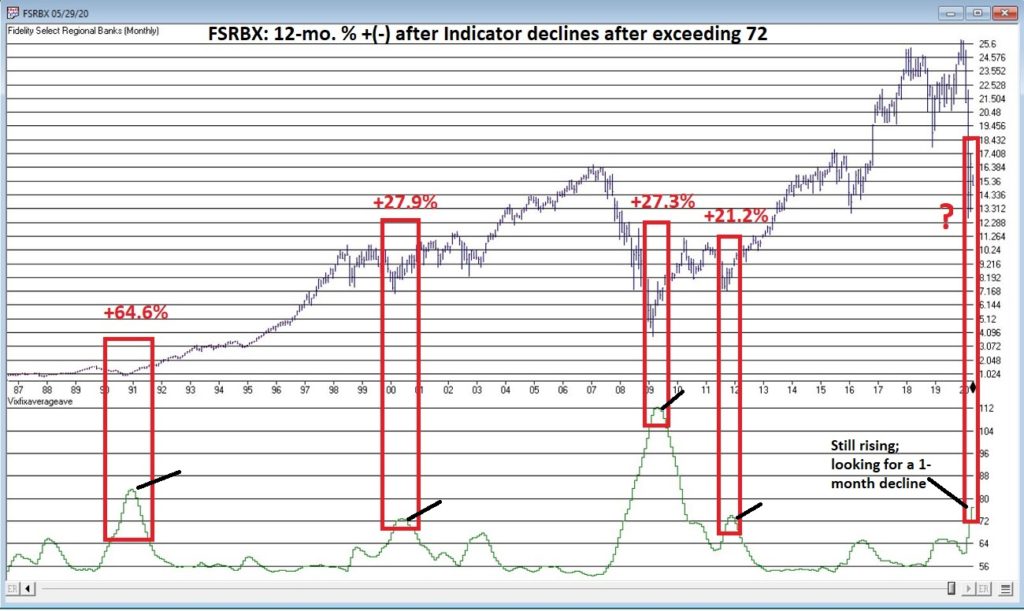
Figure 1 displays a monthly chart for FSRBX in the top clip and the Vixfixaverageave indicator in the bottom clip. Note that the indicator rose above 72 at the end of April 2020. As you can see there have been four previous occasions when this indicator, a) exceeded 72 and then b) reversed lower for one month. For arguments sake we will call that a buy signal.

Figure 1 – Ticker FSRBX with indicator Vixfixaverageave (Courtesy AIQ TradingExpert)
Figure 2 displays the 1 to 5 year % + (-) for FSRBX following the four previous signals. As you can see, they all proved to be exceptional buying opportunities.

Figure 2 – FSRBX returns 1 to 5 years after signal
Now for the disappointing news: if you are thinking that all we have to do is wait for this indicator to finally top out and that big profits are “guaranteed” to roll in, you are making a mistake. As they say, “past performance is no guarantee of future results.” (Sorry, I don’t make the rules). So, when the Vixfixaverageave monthly reading for FSRBX does finally roll over, the proper course of action would be to:
*Decide if you really want to act based on the signal
*Decide how much capital you are willing to commit
*Decide how much of that capital you are actually willing to risk – i.e. will you stop out if a loss exceeds x%, or do you plan to simply hold it for 1 to 5 years regardless?
Summary
There are a million and one ways to trigger an entry signal. The one discussed herein is just one more. What really separates the winners from the losers is the answers to the three questions just posed.
Vixfixaverageave Calculations
This indicator is based on another indicator called VixFix which was developed many years ago by Larry Williams.
hivalclose is hival([close],22). <<<<<The high closing price in that last 22 periods
vixfix is (((hivalclose-[low])/hivalclose)*100)+50. <<<(highest closing price in last 22 periods minus current period low) divided by highest closing price in last 22 periods (then multiplied by 100 and 50 added to arrive at vixfix value)
vixfixaverage is Expavg(vixfix,3). <<< 3-period exponential average of vixfix
vixfixaverageave is Expavg(vixfixaverage,7). <<<7-period exponential average of vixfixaverage
Jay Kaeppel
Disclaimer: The information, opinions and ideas expressed herein are for informational and educational purposes only and are based on research conducted and presented solely by the author. The information presented represents the views of the author only and does not constitute a complete description of any investment service. In addition, nothing presented herein should be construed as investment advice, as an advertisement or offering of investment advisory services, or as an offer to sell or a solicitation to buy any security. The data presented herein were obtained from various third-party sources. While the data is believed to be reliable, no representation is made as to, and no responsibility, warranty or liability is accepted for the accuracy or completeness of such information. International investments are subject to additional risks such as currency fluctuations, political instability and the potential for illiquid markets. Past performance is no guarantee of future results. There is risk of loss in all trading. Back tested performance does not represent actual performance and should not be interpreted as an indication of such performance. Also, back tested performance results have certain inherent limitations and differs from actual performance because it is achieved with the benefit of hindsight.

