In this short series I am attempting to highlight that there may be opportunities for long-term investors to occasionally and successfully hedge their stock market bets (by whatever means – raising cash temporarily, inverse funds, put options, etc.) without attempting to time every twist and turn in the market.
In this article I wrote about the propensity for the month of October to be more problematic in the late part of a decade. In this missive we will look at the “worst” month of the year – the month of September.
Sordid September
Since 1900 the Dow in September has showed:
*a gain 52 times
*a loss 67 times
*no change 1 time
*an average return of -0.95%
Not pretty.
But a closer look reveals a slightly different picture.
September with a 10-month Dow Moving Average
In this test we will determine at the end of each August the Dow Jones Industrial Average is above it’s 10-month moving average (using monthly closing price) or below.
*If the August Dow close is above the 10-month average we will call it Sep MA UP
*If the August Dow close is below the 10-month average we will call it Sep MA DOWN
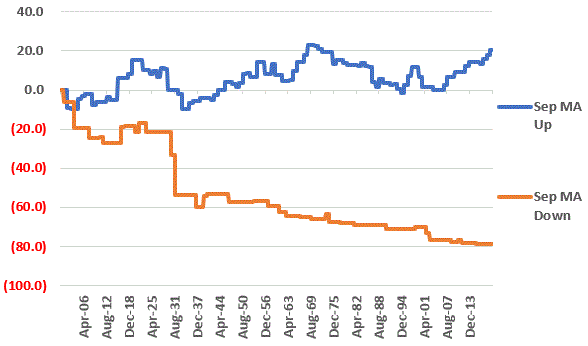
Figure 1 displays the cumulative gain for the Dow during the month of September depending on whether its Sep MA UP or Sep MA DOWN

Figure 1 – Dow cumulative September +(-) depending on whether August close was above or below 10-month moving average; 1900-2019
For the record:
*The cumulative price gain for September if Sep MA UP was +20.4%
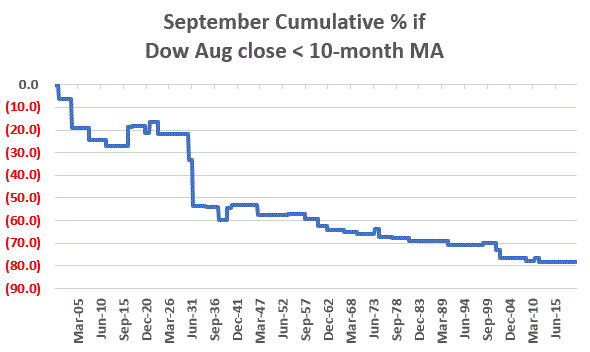
*The cumulative price loss for September if Sep MA DOWN was -78.5%
Just to make the distinction clear, Figure 2 displays the cumulative price loss for September if Sep MA DOWN.

Figure 2 – Dow cumulative September % if Dow August close was below its 10-month moving average; 1900-2019
The bottom line: the 38 Septembers that followed the Dow closing August below it’s 10-month moving average registered a cumulative decline of -78.5%.
Rhetorical question: What’s the point of “buying-and-holding” through that?
When the Dow closed August ABOVE its 10-month MA:
*the Dow had 41 up Septembers
*the Dow had 41 down Septembers
*The average result was a gain of +0.29%
When the Dow closed August BELOW its 10-month MA:
*the Dow had 11 up Septembers
*the Dow had 26 down Septembers
*the Dow had 1 unchanged September
*The average result was a loss of -3.62%
The Net Result
Using monthly closing price data (not total return data including dividends), a buy-and-hold approach using the Dow starting in 1900 gained +45,714%.
Had an investor sat out the market during the 38 Septembers that were preceded by the Dow closing below its 10-month moving average, the gain would be +210,046%.
Jay Kaeppel
Disclaimer: The information, opinions and ideas expressed herein are for informational and educational purposes only and are based on research conducted and presented solely by the author. The information presented represents the views of the author only and does not constitute a complete description of any investment service. In addition, nothing presented herein should be construed as investment advice, as an advertisement or offering of investment advisory services, or as an offer to sell or a solicitation to buy any security. The data presented herein were obtained from various third-party sources. While the data is believed to be reliable, no representation is made as to, and no responsibility, warranty or liability is accepted for the accuracy or completeness of such information. International investments are subject to additional risks such as currency fluctuations, political instability and the potential for illiquid markets. Past performance is no guarantee of future results. There is risk of loss in all trading. Back tested performance does not represent actual performance and should not be interpreted as an indication of such performance. Also, back tested performance results have certain inherent limitations and differs from actual performance because it is achieved with the benefit of hindsight.

