Yes, I understand that “market timing” and “buy-and-hold” are considered to be mutually exclusive. But as with most things in life there is always a little “wiggle room” if a person is willing to be just a little bit flexible.
Defining the Terms
Market Timing is actually a fairly broad phrase that can mean different things to different people. Unfortunately, a lot of people interpret the phrase to mean attempting to “pick tops and bottoms with uncanny accuracy”, which is – in my opinion – impossible. What IS NOT impossible is to identify situations, patterns and/or times when risk is elevated. During these times it can make a great deal of sense NOT to be fully exposed in the stock market.
Buy and Hold is in most cases exactly as it sounds. An investor puts money into the stock market via either a stock, a group of stocks, a mutual fund or an ETF with the intention of leaving it there for an extended period of time. The goal is essentially to take advantage of the fact that “in the long run, the market goes up” by exercising an unending amount of patience.
The Problems
*The problem with market timing is that it simply is extremely difficult – if not impossible – to identify the right time to buy and sell on any kind of a consistent basis.
*The problem with buy-and-hold is that you are guaranteed to have to endure extremely painful declines from time to time, and you can go a long time (12 years to 22 years historically) without making any new money.
The Solution?
Let’s suppose an investor resolves to put money in the market for the long-term, but was willing to be a little flexible, i.e., maybe willing to raise some cash, or hedge with an inverse fund or a put option at times long the way. In this situation there are a few incredibly simple market timing ideas that can be useful. Not necessarily “World-Beater, You Can’t Lose” useful, but useful nevertheless.
We will discuss the first one in this article and the others in subsequent articles.
The “Dreaded” Month of October
The month of October has a bad reputation in the stock market, often getting referred to as “Crash Month”. But there is an interesting phenomenon based on the Decennial Pattern which looks at market performance across a decade, starting with Year “0” (1900, 1910, etc.) and ending with Year “9” (1909, 1919, etc.).
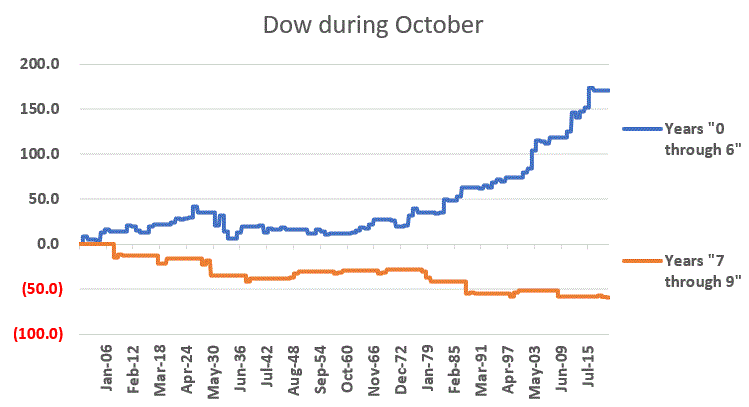
In Figure 1 the blue line displays the cumulative gain for the Dow during the month of October ONLY during the first 7 years of each decade (i.e., the Year ending in “0” through the Year ending in “6”) and the orange line displays the cumulative gain for the Dow during the month of October ONLY during the last 3 years of each decade (starting with Year “7”, i.e., 1907, 1917, etc.).

Figure 1 – Dow Jones Industrial Average cumulative price performance during October
For the record, the month of October showed:
*A gain of +170.6% during Year’s “0” through “6”
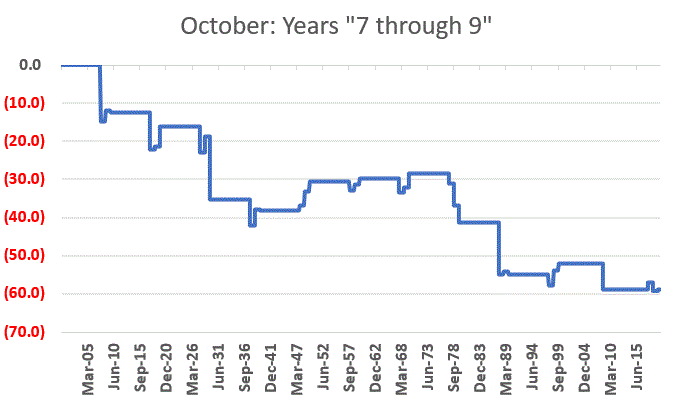
*A loss of -58.9% during Year’s “7” through “9”
Just to drive home the point, Figure 2 displays just the orange line from Figure 1, i.e., the performance of the Dow during October ONLY during Years “7”, “8” and “9”.

Figure 2 – Dow during October of Years “7”, “8” and “9”
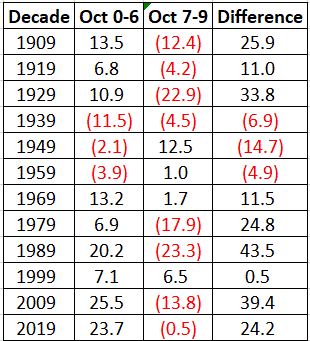
Figure 3 breaks things down decade-by-decade.

Figure 3 – Decade-by-Decade
*The column labeled “Oct 0-6” displays the cumulative price gain for the Dow in that decade during the month of October in Years “0” through “6”.
*The column labeled “Oct 7-9” displays the cumulative price gain for the Dow in that decade during the month of October in Years “7” through “9”.
*The column labeled “Difference” displays the difference between the two previous columns. Positive numbers indicate that Years 0-6 outperformed and negative numbers indicate that Years 7-9 outperformed.
As you can see, during the 30’s, 40’s and 50’s October in Years 0-6 suffered a net loss and underperformed Years 7-9. During all other decades October in Years 0-6 registered a net gain and outperformed Years 7-9.
The Net Result
Using monthly closing price data (not total return data including dividends), a buy-and-hold approach using the Dow starting in 1900 gained +45,714%.
Had an investor sat out the same 3 months every decade – the month of October during Year’s “7”, “8” and “9” – the cumulative gain would be +110,116%, or 2.43 times as much return as buy-and-hold.
Proving once again, it doesn’t have to be rocket science….
Jay Kaeppel
Disclaimer: The information, opinions and ideas expressed herein are for informational and educational purposes only and are based on research conducted and presented solely by the author. The information presented represents the views of the author only and does not constitute a complete description of any investment service. In addition, nothing presented herein should be construed as investment advice, as an advertisement or offering of investment advisory services, or as an offer to sell or a solicitation to buy any security. The data presented herein were obtained from various third-party sources. While the data is believed to be reliable, no representation is made as to, and no responsibility, warranty or liability is accepted for the accuracy or completeness of such information. International investments are subject to additional risks such as currency fluctuations, political instability and the potential for illiquid markets. Past performance is no guarantee of future results. There is risk of loss in all trading. Back tested performance does not represent actual performance and should not be interpreted as an indication of such performance. Also, back tested performance results have certain inherent limitations and differs from actual performance because it is achieved with the benefit of hindsight.

