I have written on several occasions about using the Japanese stock market to time U.S. treasury bonds. Which I admit sounds somewhat absurd when you first mention it. But let’s take another look and also add a second indicator to the mix and you can decide for yourself.
Ticker EWJ
Ticker EWJ is the iShares MSCI Japan ETF, which started trading in 1996 and which tracks the MCSI Japan Index. For our purposes, what matters is that its price action has historically been inversely correlated to the price action of U.S. treasury bonds. Using weekly data for EWJ and ticker TLT (the iShares 20+ Yr. treasury bond ETF) has a correlation of -0.26 (1.00 = perfectly correlated, -1.00 = perfectly inversely correlated).
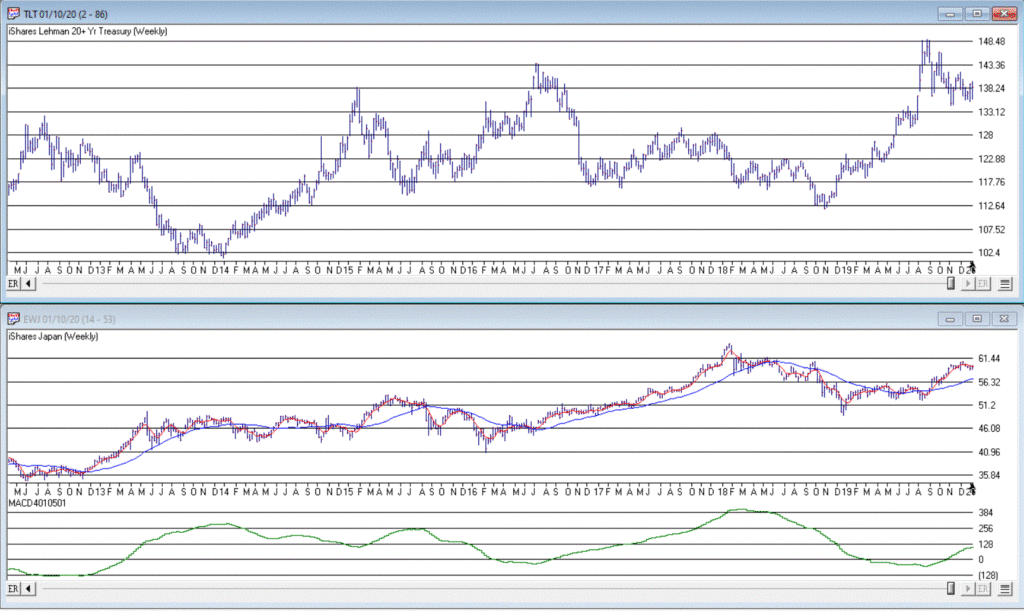
Figure 1 displays a weekly chart of TLT on the top and EWJ on the bottom. There are two indicators overlaid the EWJ chart. On the price chart is the 5-week and 30-week moving averages. In the lower click is something I call MACD4010501 (which is simply the standard MACD indicator but using parameters of 40/105/1 on a weekly chart).

Figure 1 – Top: Ticker TLT; Bottom: Ticker EWJ with 5-week and 30-week moving averages and MACD40501 indicator (Courtesy AIQ TradingExpert)
Here is what you need to know about what we will call the EWJ/Bond Model:
A) If 5-wk MA < 30-wk MA that is bullish for bonds
B) If MACD4010501 is trending lower that is bullish for bonds
C) If 5-wk MA > 30-wk MA that is bearish for bonds
D) If MACD4010501 is trending higher that is bearish for bonds
Trading Rules:
If EITHER A or B is bullish then the EWJ/Bond Model is BULLISH for bonds; Hold Ticker TLT
If BOTH C and D are bearish then the EWJ/Bond Model is BEARISH for Bonds; Sell ticker TLT
Figures 2 and 3 give an idea of the potential usefulness of all of this. Figure 2 displays the cumulative price % +(-) for TLT when the EWJ/Bond Model is bullish.

Figure 2 – TLT cumulative price % +(-) when EWJ/Bond Model is bullish (2002-present)
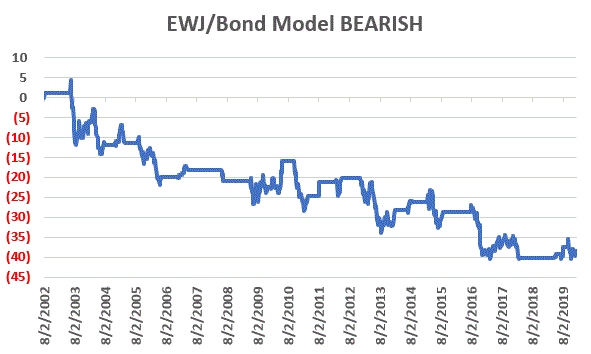
Figure 3 displays the cumulative price % +(-) for TLT when the EWJ/Bond Model is bearish.

Figure 3 – TLT cumulative price % +(-) when EWJ/Bond Model is bearish (2002-present)
For the record:
*TLT gained +170% when the EWJ/Bond Model was bullish
*TLT lost -39% when the EWJ/Bond Model was bearish
NOTE: The results shown do not include any dividends paid while holding TLT nor any interest while out of TLT.
Summary
So, is this the be all, end all of bond trading? Not likely. It does however appear to do a pretty good job keeping investors on the right side of the bond market. For the record, the last signal was a “Sell” (i.e., both EWJ indicator were bearish) on 9/20/19.
Jay Kaeppel
Disclaimer: The information, opinions and ideas expressed herein are for informational and educational purposes only and are based on research conducted and presented solely by the author. The information presented does not represent the views of the author only and does not constitute a complete description of any investment service. In addition, nothing presented herein should be construed as investment advice, as an advertisement or offering of investment advisory services, or as an offer to sell or a solicitation to buy any security. The data presented herein were obtained from various third-party sources. While the data is believed to be reliable, no representation is made as to, and no responsibility, warranty or liability is accepted for the accuracy or completeness of such information. International investments are subject to additional risks such as currency fluctuations, political instability and the potential for illiquid markets. Past performance is no guarantee of future results. There is risk of loss in all trading. Back tested performance does not represent actual performance and should not be interpreted as an indication of such performance. Also, back tested performance results have certain inherent limitations and differs from actual performance because it is achieved with the benefit of hindsight.

