I keep seeing headlines about the “imminent” re-emergence of commodities as a viable investment as an asset class. And as I wrote about here, I mostly agree wholeheartedly that “the worn will turn” at some point in the years ahead, as commodities are historically far undervalued relative to stocks.
The timing of all of this is another story. Fortunately, it is a fairly short and simple story. In a nutshell, it goes like this:
*As long as the U.S. Dollar remains strong, don’t bet heavy on commodities.
The End
Well not exactly.
The 2019 Anomaly
The Year 2019 was something of an anomaly as both the U.S. Dollar and precious metals such as gold and silver rallied. This type of action is most unusual. Historically gold and silver have had a highly inverse correlation to the dollar. So, the idea that both the U.S. Dollar AND commodities (including those beyond just precious metals) will continue to rise is not likely correct.
Commodities as an Asset Class
When we are talking “commodities as an asset class” we are talking about more than just metals. We are also talking about more than just energy products.
The most popular commodity ETFs are DBC and GSG as they are more heavily traded than most others. And they are fine trading vehicles. One thing to note is that both (and most other “me too” commodity ETFs) have a heavy concentration in energies. This is not inappropriate given the reality that most of the industrialized world (despite all the talk of climate change) still runs on traditional fossil fuel-based energy.
But to get a broader picture of “commodities as an asset class” I focus on ticker RJI (ELEMENTS Linked to the Rogers International Commodity Index – Total Return) which diversifies roughly as follows:
Agriculture 40.90%
Energy 24.36%
Industrial Metals 16.67%
Precious Metals 14.23%
Livestock 3.85%
Note that these allocations can change over time, but the point is that RJI has much more exposure beyond the energy class of assets than alot of other commodity ETFs.
RJI vs. the Dollar
As a proxy for the U.S. Dollar we will use ticker UUP (Invesco DB US Dollar Index Bullish Fund). Figure 1 displays the % gain/loss for UUP (blue line) versus RJI (orange line) since mid-2008.

Figure 1 – UUP versus RJI; Cumulative Return using weekly closing prices; May-2008-Sep-2019
*Since May of 2008 UUP has gained +17.2%
*Since May of 2008 RJI has lost -60%
The correlation in price action between these two ETFs since 2008 is -0.76 (a correlation of -1.00 means they are perfectly inverse), so clearly there is (typically) a high degree of inverse correlation between the U.S. dollar and “commodities”.
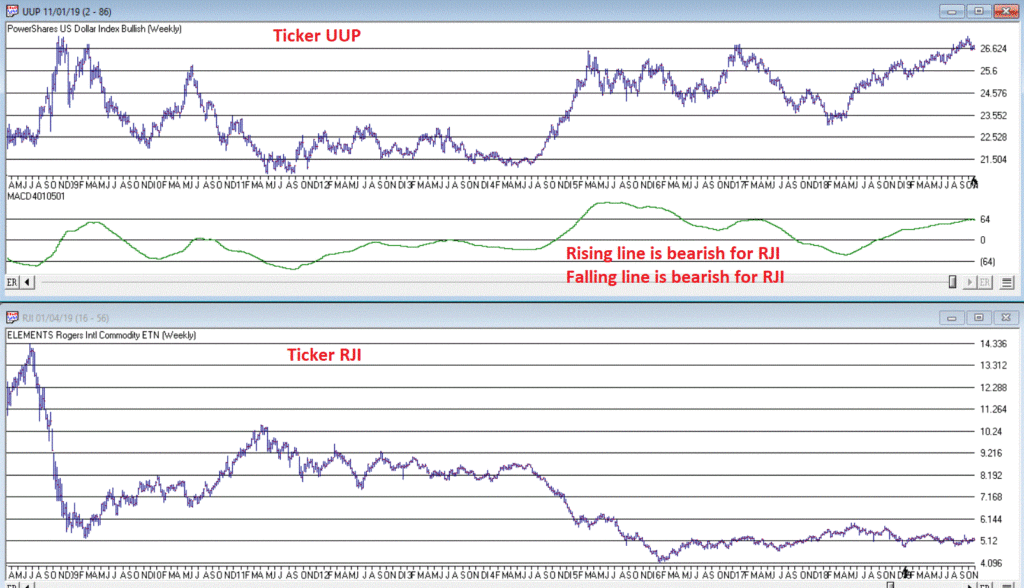
Next, we will apply an indicator that I have dubbed “MACD4010501” (Note to myself: come up with a better name). The calculations for this indicator will appear at the end of the article (but it is basically a 40-period exponential average minus a 105-period exponential average). In Figure 2 we see a weekly chart of ticker UUP with this MACD indicator in the top clip and a weekly chart of ticker RJI in the bottom clip.

Figure 2 – UUP with Jay’s MACD Indicator versus ticker RJI
Interpretation is simple:
*when the MACD indicator applied to UUP is declining, this is bullish for RJI
*when the MACD indicator applied to UUP is rising, this is bearish for RJI.
Figure 3 displays the growth of equity achieved by holding RJI (using weekly closing price data) when the UUP MACD Indicator is declining (i.e., RJI is bullish blue line in Figure 3) versus when the UUP MACD Indicator is rising (i.e., RJI is bearish orange line in Figure 3).

Figure 3 – RJI cumulative performance based on whether MACD indicator for ticker UUP is falling (bullish for RJI) of rising (bearish for RJI)
In sum:
*RJI gained +45.8% when the UUP MACD indicator was falling
*RJI lost -72.3% when the UUP MACD indicator was rising
The bottom line is that RJI rarely makes much upside headway when the UUP MACD Indicator is rising (i.e., is bearish for RJI).
Summary
Commodities as an asset class are extremely undervalued on a historical basis compared to stocks. However, the important thing to remember is that “the worm is unlikely to turn” as long as the U.S. Dollar remains strong.
So, keep an eye on the U.S. Dollar for signs of weakness. That will be your sign that the time may be coming for commodities.
FYI: Code for Jay’s MACD4010501 Indicator
The indicator is essentially a 40-period exponential average minus a 105-period exponential average as shown below:
Define ss3 40.
Define L3 105.
ShortMACDMA3 is expavg([Close],ss3)*100.
LongMACDMA3 is expavg([Close],L3)*100.
MACD4010501 is ShortMACDMA3-LongMACDMA3.
Jay Kaeppel
Disclaimer: The information, opinions and ideas expressed herein are for informational and educational purposes only and are based on research conducted and presented solely by the author. The information presented does not represent the views of the author only and does not constitute a complete description of any investment service. In addition, nothing presented herein should be construed as investment advice, as an advertisement or offering of investment advisory services, or as an offer to sell or a solicitation to buy any security. The data presented herein were obtained from various third-party sources. While the data is believed to be reliable, no representation is made as to, and no responsibility, warranty or liability is accepted for the accuracy or completeness of such information. International investments are subject to additional risks such as currency fluctuations, political instability and the potential for illiquid markets. Past performance is no guarantee of future results. There is risk of loss in all trading. Back tested performance does not represent actual performance and should not be interpreted as an indication of such performance. Also, back tested performance results have certain inherent limitations and differs from actual performance because it is achieved with the benefit of hindsight.

