This article is inspired by an extremely useful series of articles authored by an author who goes by the name of “Ploutus” which were published on www.SeekingAlpha.com (which is one of my favorite websites for market related thought. In that vein, as an FYI another of my favorite sites is www.McVerryReport.com). One of those articles is this one (which also contains links to several of his or her other) which details how small-cap value has outperformed buying and holding the S&P 500 Index over many years.
In this article I will offer a slightly different approach than simply buying and holding small-cap value stocks.
The Data
*To do testing, for small-cap index data I used monthly total return data for the Russell 2000 Value Index from January 1980 through December 1993 and the S&P 600 Value Index starting in January 1994 through June 2019
*For a benchmark I used monthly total return data for the S&P 500 Index since January 1980
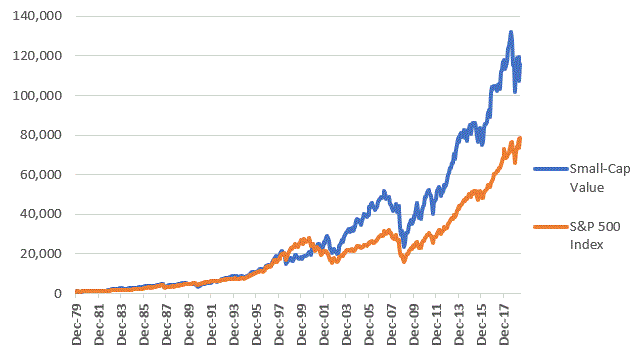
Figure 1 displays the growth of $1,000 invested in both of the above on a buy-and-hold basis from January 1980 through June 2019. Figure 1 – Growth of $1,000 invested in Small-Cap Value (blue) versus S&P 500 Index (orange); 12/31/1979-6/30/2019
Sure enough, the good news is that small-cap value has outperformed the S&P 500 Index by a factor of 1.48-to-1 (+11,486% versus +7,746%). The bad news is that the returns were quite volatile and cannot necessarily be described as “consistently better”.
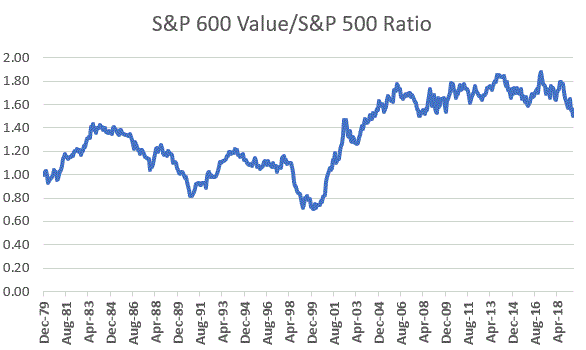
To illustrate, Figure 2 displays the growth of small-cap value divided by the growth of the S&P 500. When the line is rising it means small-cap value is outperforming and vice versa. As you can see there is a lot of give and take along the way. Small-cap value had a strong period of outperformance in the middle but before and after that the S&P 500 has spent as much time outperforming as underperforming.
From November 2016 through June 2019 the S&P 500 gained +38% versus only 11% for the S&P 600 Value Index. This type of underperformance makes it hard for investors to “sit tight” in small-cap value. Figure 2 – Ratio of Small-Cap Value to S&P 500
So, we will herein examine an approach that switches between the two indexes rather than just choosing one index or simply “splitting” money between the two.
The Test
At the end of each month we will measure the 12-month total return for both the S&P 600 Value Index and the S&P 500 Index.
If the 12-month total return for the S&P 600 Value Index is greater then we want to hold that index the following month, and vice versa.
One technical note: We are using total return data for our test (which includes price appreciation plus any dividend income). With the database that I use this data is not available until early in the next month so there is no way to do the month-end calculation and make a trade – if necessary – at the end of the month. For this reason, we will use a 1-month lag in applying trading signals as explained in the following example:
In say early January we get the December total return numbers for the two indexes. At that time, we will update the 12-month rate-of-change for each index as of the end of December. If the S&P 600 Value Index has a higher 12-month rate-of-change at the end of December, then at the end of January (the current month) we want to be long that index (i.e., as of the close of the last trading day of January). In early February we get the January total return numbers for the two indexes. At that time, we will update the 12-month rate-of-change for each index as of the end of January. If the S&P 600 Value Index has a higher 12-month rate-of-change at the end of January then we will simply continue to hold that index at least through the end of March. On the other hand, if at the end of January, the S&P 500 Index now has a higher 12-month rate-of-change then at the end of February we will sell the S&P 600 Value Index and buy the S&P 500 Index.
The Results
Starting 12/31/1979 through 6/30/2019:
*$1,000 invested in the S&P 600 Value Index using buy-and-hold grew to $115,862
*$1,000 invested in the S&P 500 Index using buy-and-hold grew to $78,460
*The average of these two is $97,161
*We will use a slightly modified approach as our benchmark. At the end of each calendar year we will rebalance so that both indexes start the new year with 50% of the portfolio. Using this approach, “splitting” money 50/50 each year between the two indexes grew to $102,839, or +10,184%
*During the same period, $1,000 invested using our switching method discussed above grew to $164,484, or +16,348%.
The results of the “Switching” versus “splitting” approaches appear in Figure 3.
 Figure 3 – Growth of $1,000 invested using the “Switching” approach (blue) versus the “Splitting” approach (orange); 12/31/1979-6/30/2019
Review
It should be noted that the “Switch” method is by no means a “low risk”, or even a “lower risk” strategy. The maximum drawdown of -56.5% (during the 2008-2009 bear market) is a mindbender for most investors. Still, it is only slightly higher than buying and holding the S&P 600 Value Index (-53.3%) or the S&P 500 Index (-50.9%). And one can argue that an investor is well compensated for assuming any additional volatility or risk, as the “Switch” method gained +16,348% versus +7,746% for buying-and-holding the S&P 500 Index.
Figure 4 displays some comparative data. Figure 4 – Comparative Results
Other tidbits:
*The “Switch” approach outperformed the “Split” approach during 79% of all rolling 5-year periods
*In 473 months of testing, the “Switch” approach made 59 trades. This works out to an average of 1.5 trades per year. 13 years had 0 trades, 9 years had 1 trade, 6 years had 2 trades, 8 years had 3 trades and 3 years (1985, 1997, 2006) had 4 trades.
Summary
Is this any way to invest? That’s not for me to say. What we do know is that buying and holding small-cap value stocks has vastly outgained buying and holding the S&P 500 Index over the past roughly 39+ years (+11,486% versus +7,746%). Likewise, switching between small-cap value and the S&P 500 as detailed herein has performed buying and holding the S&P 500 Index by an even bigger amount (+16,348% versus + 7,746%).
Food for thought.
Jay Kaeppel
Disclaimer: The data presented herein were obtained from various third-party sources. While I believe the data to be reliable, no representation is made as to, and no responsibility, warranty or liability is accepted for the accuracy or completeness of such information. The information, opinions and ideas expressed herein are for informational and educational purposes only and do not constitute and should not be construed as investment advice, an advertisement or offering of investment advisory services, or an offer to sell or a solicitation to buy any security.


Hi Jay,
Why not add a Bond ETF or cash if both the SP600 Value Fund or SPY is negative? Does that decrease the volatility with out sinking too much of the gains?
Dennis
Dennis, have not tested that so can’t really say. Good food for thought though! Jay
Jay, I am thinking IEI or TLT. Thanks, Dennis