The silver market has been driving traders, well, crazy lately, as it refuses to go anywhere. As you can see in Figure 1, silver prices have been narrowing into an ever and ever tighter range for quite some time now. Despite all of the (incorrect) prognostications (including my own) that silver is “due” to break out into a major trend, nothing, zilch, nada. The price range just coils tighter and tighter.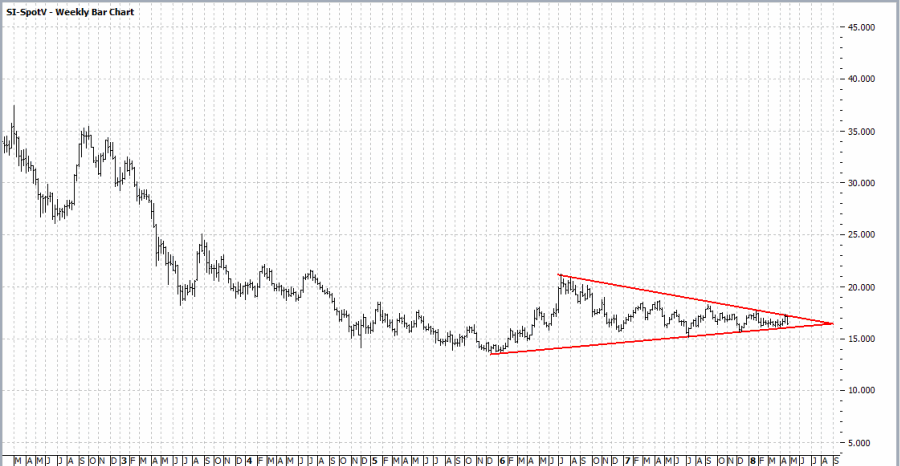 Figure 1 – Silver “coiling” (Courtesy ProfitSource by HUBB)
As you can see in Figure 2, silver has a “history” of this kind of thing happening, followed by “something crazy” (usually, though not always.)
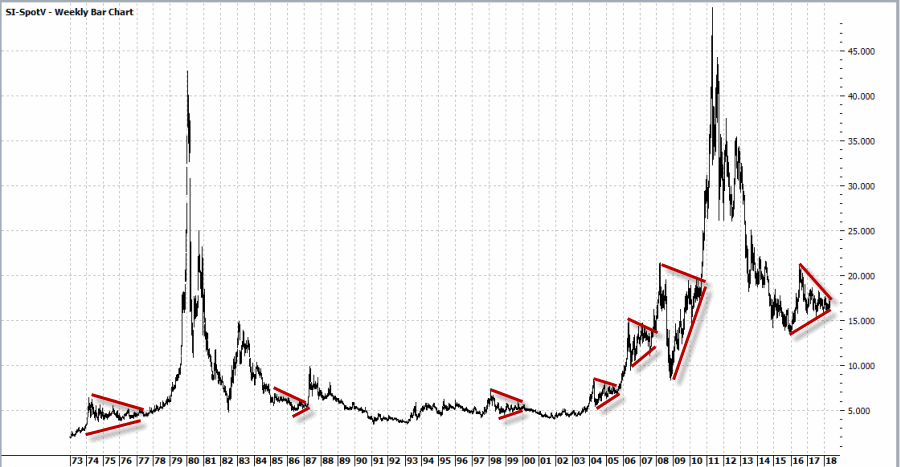 Figure 2 – Silver’s history of “coiling”, and what comes after (Courtesy ProfitSource by HUBB)
Despite the fact that silver has so far refused to cooperate, there are a few things we can say at this point. Among them:
1) Silver is much closer to forging the next major trend than it was several months (or years ago).
2) The type of “coiling” action we have seen for at least the better part of a year and a half is often followed by an explosive move in one direction or another (a word of warning: often preceded by a fake out in the other direction).
3) As you can see in Figure 3, the implied volatility for options on ticker SLV (an ETF that tracks the price of silver) has collapsed to a very low level. This tells us that there is relatively little time premium built into the price of the options, i.e., that SLV options are “cheap.”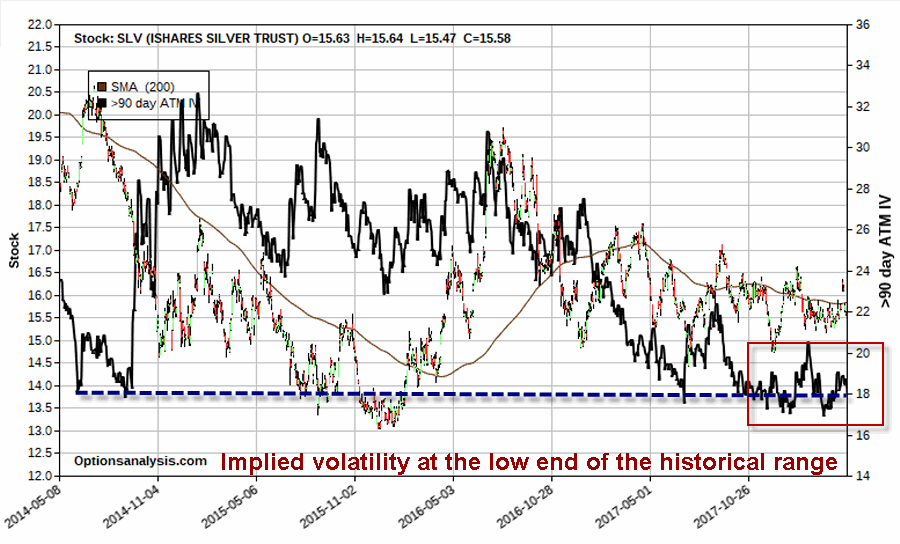 Figure 3 – SLV options are “cheap” as implied option volatility is extremely low on a historical basis (Courtesy www.OptionsAnalysis.com)
A Crazy Play in Case Things Get Crazy
What follows is NOT a trading recommendation. In fact, it’s not even a strategy that most traders would ever employ. However, it:
1) Is an excellent illustration of the flexibility that option traders have in crafting a position
2) Affords profit potential if SLV breaks out significantly in either direction
3) Can accumulate even more value if and when implied volatility ever perks up again (the more the better)
4) And my personal favorite, it only costs $147 to enter
In technical options parlance this trade might be referred to as “an out-of-the-money call butterfly spread paired with a long put” (Do NOT attempt to say that three times fast). The position involves:
*Buying 2 SLV Jan2019 17 calls @ $0.67
*Selling 3 SLV Jan2019 23 calls @ $0.09
*Buying 2 SLV Jan2019 29 calls @ $0.02
*Buying 3 SLV Jan2019 13 puts @ $0.12
The particulars are shown in Figure 4 and the risk curves in Figure 5.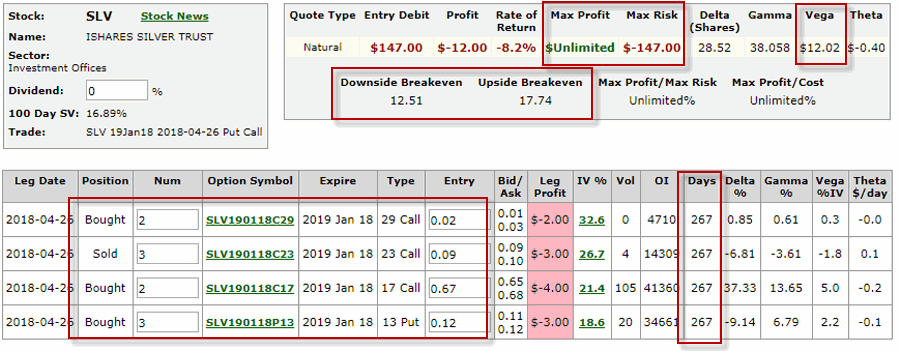 Figure 4 – SLV example trade particulars(Courtesy www.OptionsAnalysis.com)
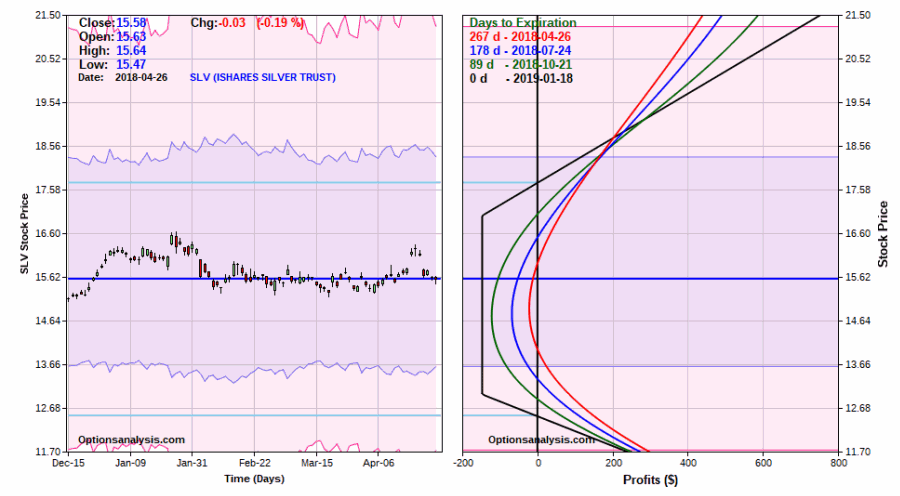 Figure 5 – SLV example risk curves (Courtesy www.OptionsAnalysis.com)
Here is what you need to kow:
*This trade is nothing more than a wildly aggressive speculation that SLV will break out of the current “coil” (at the far right of Figure 2) in a meaningful way sometime between now and mid January 2019.
*Clearly if SLV does NOT make some kind of a significant price move between now and mid January 2019, this trade will lose money. Hence the reason we are taking a small dollar risk and not “betting the farm.”
*If SLV soars or collapses this trade has significant profit potential.
*Finally, if implied volatility perks up from its current slumber and spikes to higher levels, that can inflate the profit potential (at least prior to expiration) of this trade. Remember, that a rise in IV would inflate the amount of time premium built into the options.
Summary
Is SLV going to make a significant move (finally!!) between now and mid January? It beats me. Remember, this trade is NOT a recommendation, only an illustration of a possibility available to option traders who answer in the affirmative to the following three questions:
1) Do you think there is a chance that SLV will make a significant price move between now and mid-January 2019?
2) Do you think there is a chance that the implied volatility for options on SLV will rise from their current low levels between now and mid-January 2019?
3) Do you have $147 bucks?
Jay Kaeppel
Disclaimer: The data presented herein were obtained from various third-party sources. While I believe the data to be reliable, no representation is made as to, and no responsibility, warranty or liability is accepted for the accuracy or completeness of such information. The information, opinions and ideas expressed herein are for informational and educational purposes only and do not constitute and should not be construed as investment advice, an advertisement or offering of investment advisory services, or an offer to sell or a solicitation to buy any security.

