With crude oil hitting its highest level since November of 2014, the energy sector is suddenly drawing a lot of interest. But there are few caveats that investors might want to keep in mind before getting too far ahead of themselves.
(BTW: If you enjoy reading JayOnTheMarkets.com – heck, even if you hate reading JayOnTheMarkets.com – please tell others and encourage them to stop by, “Like” an article, link an article, etc.. Thanks, The Management)
Energy Seasonality
Figure 1 (from www.Sentimentrader.com, which is quickly becoming one of my favorite sites) displays the annual seasonal calendar for ticker XLE – the SPDR Energy ETF. While it should be pointed out that it certainly is not like every year plays out like this chart, the primary point is that the “meat” part of year of from the end of January through the end of April is nearing the end of the line. Figure 1 – XLE Seasonality (Courtesy: www.Sentimentrader.com)
XLE Overhead Resistance
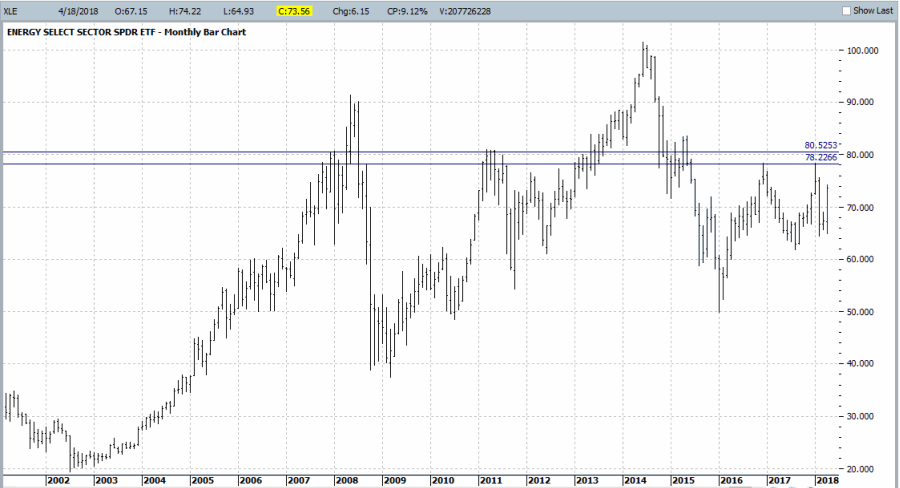
XLE has had a terrific month of April, rallying over 14% since the low on 4/2. And while it has been an impressive show of momentum, a look at the “bigger picture” points to some key levels of potential resistance just ahead.
Figure 2 is a monthly bar chart of XLE with two significant resistance levels drawn (at roughly $78.25 and $80.50). XLE has failed twice previously at roughly $78.40 – in December 2016 and again in January of 2018. Figure 2 – XLE Monthly with overhead resistance (Courtesy ProfitSource by HUBB)
On the plus side, XLE is clearly trending higher at the moment and there is still another 6.4% and 9.4% of upside potential between the current price and the resistance levels drawn in Figure 2. So short-term upside potential remains.
The only real “warning” I am raising is to pay attention to “what happens (if and) when we get there” (“there” being the $78.25-$80.50 range).
Jay’s Energy ETF Index
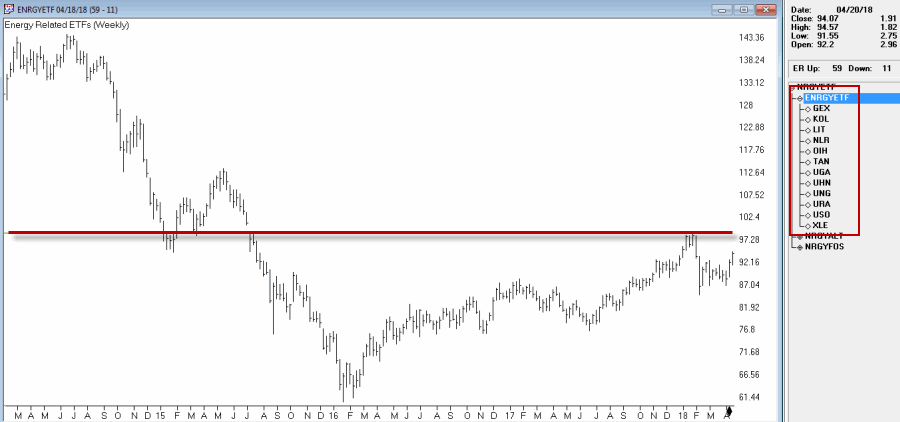
I created and follow an index of all manner of energy related ETFs (it combines traditional fossil fuel related ETFs with alternative energy source ETFs). A monthly chart with a significant resistance level drawn appears in Figure 3. Figure 3 – Jay’s Energy ETF Index (Courtesy AIQ TradingExpert)
Figure 4 “zooms in” on Figure 3 using a daily bar chart of my Energy ETF Index. As you can see, as nice as the latest rally has been, there is a “day of reckoning” looming out there somewhere if the energy sectors keeps going and retests this significant level.
 Figure 4 – Jay’s Energy ETF Index; Daily (Courtesy AIQ TradingExpert)
For the record this index is comprised of:
GEX – Alternative Energy
KOL – Coal
LIT – Lithium
NLR – Nuclear
OIH – Oil Service
TAN – Solar
UGA – Gasoline
UHN – Heating Oil
UNG – Natural Gas
URA – Uranium
USO – Crude Oil
XLE – Energy Sector
Summary
Some might interpret this piece as a bearish to neutral word of warning related to the energy sector. In reality I am pretty agnostic when it comes to energy and (sadly) can’t offer you a “prediction” that would do you any good.
But I will be watching closely to see what happens to XLE and my own index if and when the key resistance levels are tested – especially if that test occurs after the end of the most favorable February through April period.
Commodity related assets – such as energy, especially fossil fuels – appear “due” for a favorable move relative to stocks. If and when these key resistance levels are pierced we could see an “off to the races” situation unfold.
Until then, be careful about “bumping your head.”
Jay Kaeppel
Disclaimer: The data presented herein were obtained from various third-party sources. While I believe the data to be reliable, no representation is made as to, and no responsibility, warranty or liability is accepted for the accuracy or completeness of such information. The information, opinions and ideas expressed herein are for informational and educational purposes only and do not constitute and should not be construed as investment advice, an advertisement or offering of investment advisory services, or an offer to sell or a solicitation to buy any security.

