Let’s cut to the chase. Objective reality is dead. This is obviously true in politics as two sides will furiously spin the exact same event in two entirely different manners. But it has already long been true in the financial markets.
Here’s the reality: if you “want” to be bullish you can find 1,001 things that will “justify” your outlook. But at that exact same moment, if someone else “wants” to be bearish they can easily trot out 1,001 other things to justify their outlook.
And then we wait around for the markets to tell us who was right. And so on and so forth, same as it ever was.
I mention all of this because the charts I am about to show you are kind of “all over the place.” Please note that the purpose of these charts is not to sway you into being bullish or bearish on anything. Each Figure stands on its own and you can see whatever you “want” to see.
#1. After a Big UP January
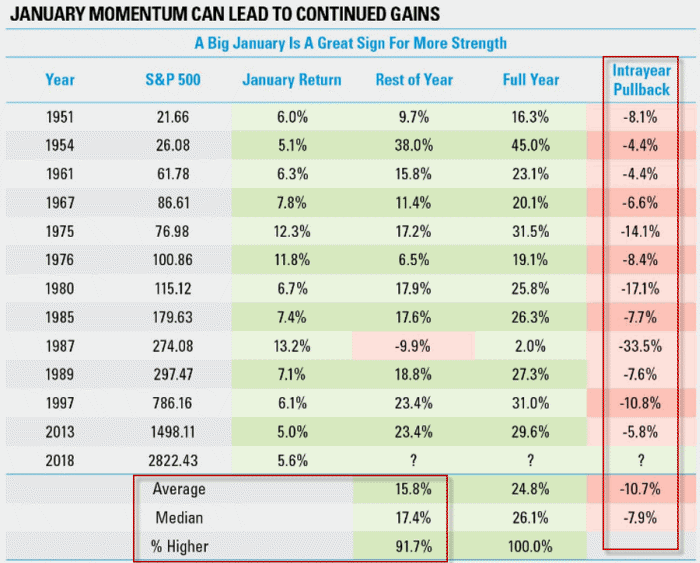
January saw the S&P 500 gain +5.6%. Things haven’t gone too well since. Still, as you can see in Figure 1 history suggest that there is good news and bad news. The good news is that 11 of the previous 12 such years since 1951 have seen the S&P tack on additional gains between the end of January and the end of December. The average end of Jan. to end of Dec. gain following an S&P 500 gain of 5% or more in January has been +15.8%. The bad news is that the average intra year drawdown was -10.7%. And of course, don’t forget that 1987 (and the October crash) is on this list.
So the message is clearly “Hope for the best, prepare for the worst.”
 Figure 1 – February through December Performance following 5% S&P 500 gain (Source: um, I made a note somewhere regarding where I found this table. Now if I could just find that note…..if you are reading this and you are the person who published this table please let me know and I promise I will give you full credit)
#2. Seasonally Favorable Period for Junk Bonds
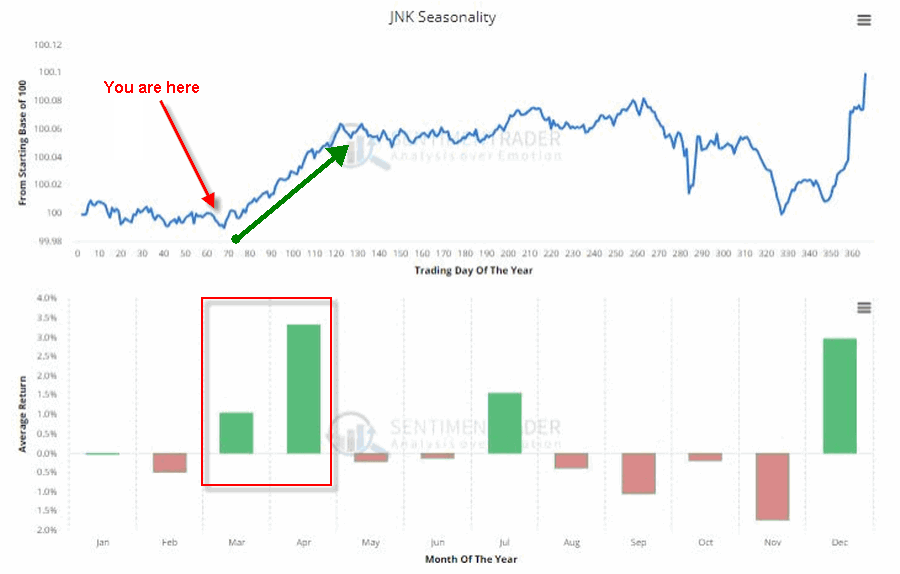
Everybody hates bonds at the moment, especially junk bonds that are far more highly correlated to the S&P 500 Index than to long-term treasuries. Is there a better time to be a contrarian? Figure 2 from sentimentrader.com highlights the fact that we are entering the seasonally best time of year for ticker JNK (an ETF holding a portfolio of high yield bonds). As with all things related to seasonality there is no guarantee that this year will follow the long term trend. But if junk bonds rally in the near-term about 90% of investors would be surprised. Again, is there a better time to be a contrarian?
 Figure 2 – Seasonality for ticker JNK (Source: www.sentimentrader.com)
#3. 10-Yr Treasury/2-Year Treasury Spread
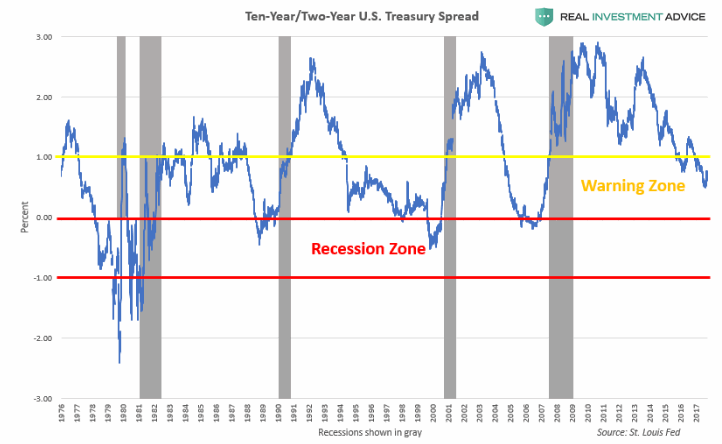
More often than not, economic recessions in the U.S. are preceded by an “inversion” of the yield curve. In a nutshell, 10-year yields are normally above 2-yr yields, but when that relationship inverts it signals “something not quite right” in the economy. As you can see in Figure 3 it is by no means time to panic. But it is time to start paying attention. Figure 3 – 10-Yr. Treasury/2-Year Treasury Spread (Source: RealInvestmentAdvice)
#4. Are We Drowning (in Debt) Yet?
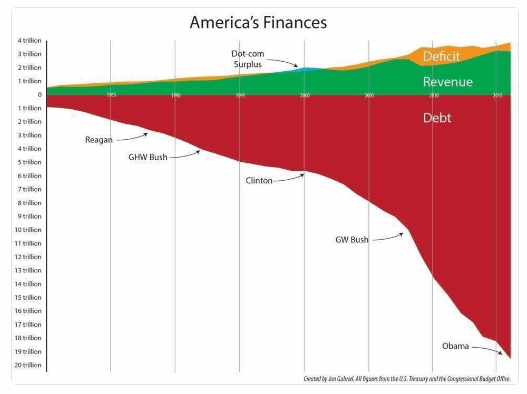
Let’s be brutally candid. No one cares about the national debt. Oh, I mean sure a lot of people care and are disturbed and wonder how this ends well. But the point is that no one (whether an “elected” or an “elector”) has this as a top priority or is doing anything about it. Maybe because no one can figure out what to do about it. Still, Figure 4 is a bit sobering. Again, “how does this end well?”
Also, as I mentioned before about objective reality, please note that the average Republican will look at Figure 4 and say “look at all debt those $%^& Democrats created!” And the average Democrat will look at Figure 4 and say “look at all the debt those $%^& Republicans created!”
Sorry folks, but this is truly a “bipartisan” creation.
 Figure 4 – Drowning in Debt Yet? (Source: Jon Gabriel)
Jay Kaeppel
Disclaimer: The data presented herein were obtained from various third-party sources. While I believe the data to be reliable, no representation is made as to, and no responsibility, warranty or liability is accepted for the accuracy or completeness of such information. The information, opinions and ideas expressed herein are for informational and educational purposes only and do not constitute and should not be construed as investment advice, an advertisement or offering of investment advisory services, or an offer to sell or a solicitation to buy any security.

