I know what you’re thinking –“Dude, the holiday season just ended, you can’t miss them that badly yet.” For the record, a) Yes I can, and, b) the title is not actually referring to the Christmas/New Years time frame jut past. It refers to stock market Holiday’s in general.
This article is essentially a follow-up to this article and this article from last January.
One Approach to Market Holidays
So here’s a question. What would the results look like if we bought and held the Dow Jones Industrials Average only during the 3 trading days before and the 3 trading days after each stock market holiday? These include:
*Martin Luther King Day
*Presidents Day
*Easter
*Memorial Day
*Independence Day
*Labor Day
*Thanksgiving
*Christmas
*New Years
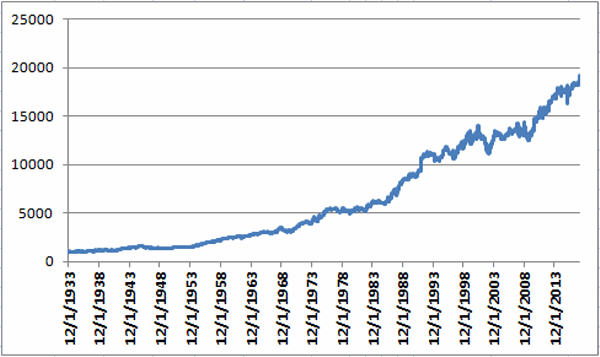
For our test we are going back to December 1933. The growth of $1,000 invested in the Dow only during the 6 trading days surrounding each stock market holiday (note that until the early 1950’s there were two holidays in February – Lincoln’s Birthday and Washington’s Birthday – which were ultimately combined into President’s Day. Also, Martin Luther King Day was first celebrated in 1998) appears in Figure 1.
In order to capture only the market action around holidays no interest is assumed to be earned during all other days. Figure 1 – Growth of $1,000 invested in Dow Jones Industrials Average ONLY during the 3 trading days before and 3 trading days after each stock market holiday; 12/1/1933-1/12/2018
The equity curve shown in Figure 1 is by no means a “straight line” advance. Nevertheless, the long-term “lower left to upper right” trend is unmistakeable.
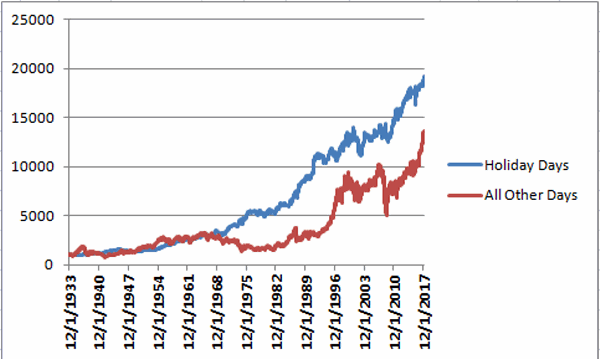
These “Holiday Days” comprise roughly 18.9% of all trading days. What makes the results fairly interesting is when we compare these “Holiday Days” to “all other trading days”.
Figure 2 displays the same line as in Figure 1. It also plots the growth of $1,000 during “all other trading days” (red line). Figure 2 – Growth of $1,000 invested during “Holiday Days” (blue line) versus “All Other Days” (red line)
For the record:
| Measure | Holiday Days | All Other Days |
| % of All Trading Days | 18.9% | 81.1% |
| $1,000 becomes | $19,168 | $13,613 |
| Total % +(-) | +1,817% | +1,261% |
| % Up Days | 54.8% | 51.9% |
| %Down/Unch Days | 45.2% | 48.1% |
| Ave. daily %+(-) | +0.0755% | +0.0194% |
| Median daily%+(-) | +0.0793% | +0.0353% |
Figure 3 – Holiday Days versus All Other Days
The most interesting finding to me in Figure 3 is the the average daily % gain for “Holiday Days” (+0.0755%) is 3.9 times greater than the average daily % gain for “All Other Days” (+0.0194%).
Trading with a Leveraged ETF
For this test we will employ the following rules:
*If today is within 3 trading days before or 3 trading days after a stock market holiday we will hold ticker UMPIX (Profunds Ultra MidCap – which tracks the daily change for the S&P 400 MidCap Index times 2).
*For all other trading days we will hold cash and will assume we earn an annualized rate of interest of 1%.
*We will start our test on 2/7/2000, which was the first day of trading for ticker UMPIX
The growth of $1,000 invested using the rules above appear in Figure 4 along with the growth of $1,000 invested in the Dow Jones Industrials average on a buy-and-hold basis during the same time. Figure 4 – Growth of $1,000 invested in ticker UMPIX using Holiday Days Trading Rules (blue line) versus buying and holding the Dow Jones Industrials Average (red line); 2/7/00-1/24/17
For the record:
*The system is in UMPIX only 20.7% of all trading days and in cash 79.3% of all trading days.
*The average annual return for System = +13.2%
*The average annual return for Dow Buy-and-Hold = +5.5%
*The maximum System drawdown was -34.3%
*The maximum Dow Buy/Hold drawdown was -53.8%
Summary
Despite the fact that “Holiday Days” comprised only 19% of all trading days since 1933, they generated a higher a greater cumulative returns than the “other” 81% of all trading days. Likewise, they realized a higher percentage of up days and a much higher average and median daily rate of return.
So once again I would like to launch my annual drive and implore each of you to join me in contacting our representatives and demanding more holidays!
Jay Kaeppel
Disclaimer: The data presented herein were obtained from various third-party sources. While I believe the data to be reliable, no representation is made as to, and no responsibility, warranty or liability is accepted for the accuracy or completeness of such information. The information, opinions and ideas expressed herein are for informational and educational purposes only and do not constitute and should not be construed as investment advice, an advertisement or offering of investment advisory services, or an offer to sell or a solicitation to buy any security.


I love studies like this. Reminds me of Norman Fosback’s work on holiday trades. I’ve always wondered why you use the Dow as your benchmark when the S&P usually is the standard. And now you’re comparing the Dow with a (leveraged) MidCap index. ProFunds, which is my fund family of choice, has a leveraged S&P fund (ULPIX) that began 11/26/97 providing a broader index with an extra 2+ years of data. Or why not UOPIX ($NDX index), the best long term performing index over the long haul? Comments, please?
1) I have daily data for the Dow going way back but not for the S&P.
2) I have not tested ULPIX specifically with Holidays. That aside I have found that MidCaps often (though not always) outperform other indexes using a variety of different methods,systems,etc.
3) NDX based indexes sometimes outperform in terms of total return (again it does depend at times on the system/method used) but almost always have significantly higher volatility and larger drawdowns. Trying to minimize those things is part of the (well,at least my) reason for developing systems/methods in the first place.
Jay
And just think if one used this simple holiday method and coupled it with a protective stop to prevent a 34% draw down what the returns would be like!
I haven’t tested the system, but stops almost always reduce returns. That said, a stop somewhere in the 25%-40% range might be smart just for peace of mind.
Just curious, how one can get 1% while in cash?
It seems macrotrends-dot-net has S&P500 daily data going back to 1927 for $8 if you are looking for one.