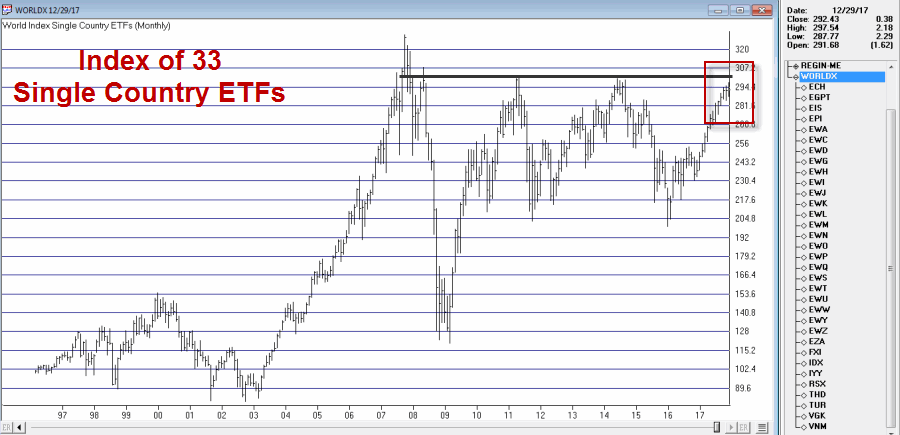
I track an index comprised of 33 single-country ETFs. The chart of that index appears in Figure 1.
(click to enlarge) Figure 1 – Jays World Index (Courtesy AIQ TradingExpert)
Two things stand out:
*World stock markets have enjoyed a terrific run since the low in early 2016.
*World stock markets (in aggregate) are fast approaching a significant resistance level (clearly marked in Figure 1).
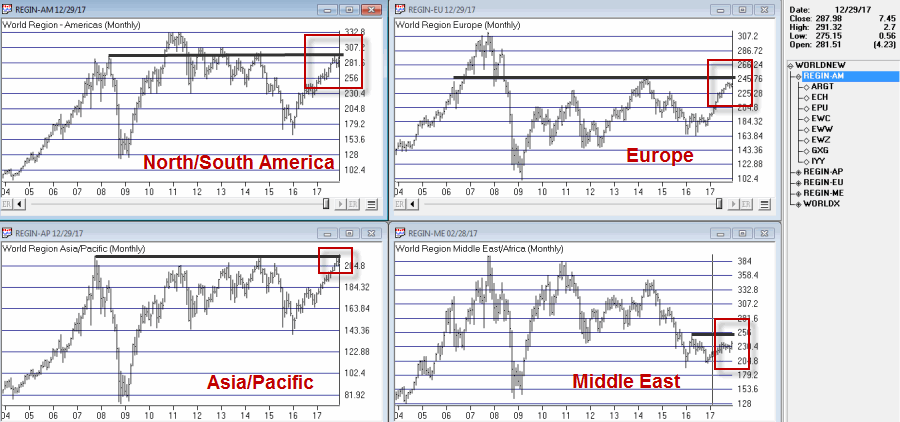
Figure 2 drills down a little and breaks the overall index into four regions:
*North/South America
*Europe
*Asia/Pacific
*Middle East
The charts for each of the groups appear in Figure 2.
(click to enlarge) Figure 2 – Jay’s Regional Indexes (Courtesy AIQ TradingExpert)
Middle East markets have been a laggard (although for the record that index is roughly 20% above its late 2016 low) but the others have witnessed a substantial run up in price.
Unfortunately, they are also all running into – or are close to running into – a major area of resistance as you can see in Figure 2.
Where to from Here
One of three things will ultimately happen:
*Markets will keep rallying and break decisively through the marked resistance levels on the way to higher new highs
*Markets will run into resistance and then turn choppy for a period of time as they decide which way to go
*The markets will run into resistance, fail to break through in any meaningful way, thus triggering a meaningful price decline
I would love to tell you which one of these scenarios is about to unfold but I am pretty lousy at “predicting” things. I am pretty decent though at identifying current trends and also areas of potential risk.
With that in mind:
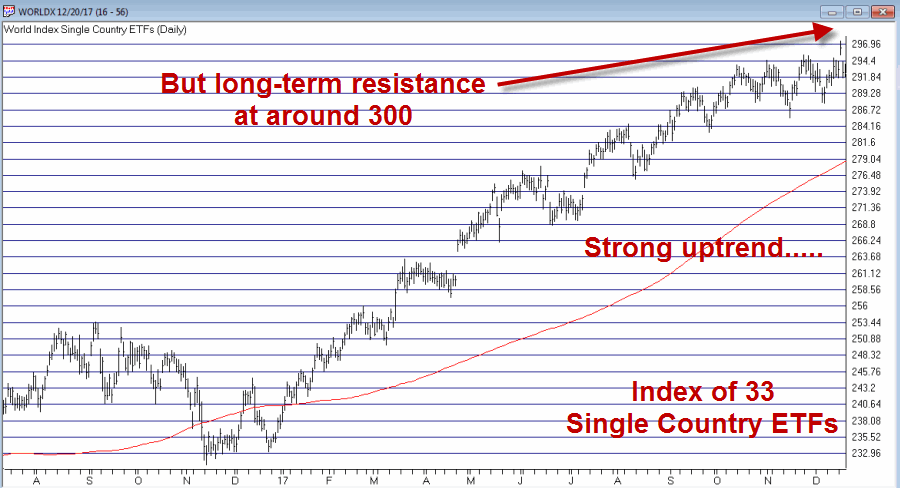
*Figure 3 displays a daily chart of the 33 ETF World Index. This is clearly an index still in a strong uptrend. So do not look at Figures 1 and 2 and assume that upside is limited and that it is time to sell. Figure 3 – Jay’s World Index daily chart; resistance at 300 (Courtesy AIQ TradingExpert)
*At the same time, the resistance level marked on Figure 1 is at about the 300 level (the index itself is presently in the 292 range). So “it won’t be long now” before the index “bumps its head.”
So pay close attention for clues as to whether the worldwide bull market will continue unabated – or if maybe we are “on the brink” (of something different).
Jay Kaeppel
Disclaimer: The data presented herein were obtained from various third-party sources. While I believe the data to be reliable, no representation is made as to, and no responsibility, warranty or liability is accepted for the accuracy or completeness of such information. The information, opinions and ideas expressed herein are for informational and educational purposes only and do not constitute and should not be construed as investment advice, an advertisement or offering of investment advisory services, or an offer to sell or a solicitation to buy any security.


Interesting charts, Jay. Thanks and merry Christmas.