2013 Market Year in Review
The analysis is actually pretty simple:
Stocks:
Financial, World and Economic News: BAD
Stock Market Performance: GREAT!
Bonds:
Investor A: Hey, have you noticed that t-bond yields have hit a 15 month high? Investor B: What, me worry?
Gold:
Ppppppphhhhhhhhttttttt!
So it is pretty obvious at this point that stocks were the place to be in 2013 (which is maybe why the Investors Intelligence poll registers just 14% bears). Of course, no one is ever content with that kernel of knowledge. We want to know what’s going to happen in the future. In fact the investing public is so hungry for “advance” knowledge that there are now thousands of pundits out there offering all kinds of wildly differing opinions.
So all the investor has to do is decide which opinion they “want to believe”, find a pundit offering that opinion, and “Voila” – they have “expert confirmation” that their opinion is “correct.”
And so it goes, and so it goes.
Meanwhile, back here in reality land, a simple trend-following approach can reap many benefits, especially when the following mantra is true for the stock market:
“If the Fed is pumpin’, the stock market’s jumpin’.” Period. End of analysis.
The Right Way and the Wrong Way to Look at Trend Following Methods
There is a right way and a wrong way to look at trend-following indicators:
The Wrong Way: “Wow, my handy dandy trend following indicator is bullish at the moment, therefore I can extrapolate this out to mean that this bullish trend will continue for some time to come.”
The Right Way: “Well, the trend is up at the moment, but of course this could change at any moment, so while I won’t panic and sell everything as long as the trend is still up, I will check back often and if the trend changes I will change my thinking and actions accordingly.”
The most important thing to remember about trend-following indicators is this:
-There is no “prediction” built into the current reading
In other words, a trend-following method does nothing more than identify the current trend right now. Tomorrow is a different day. While this may not “sound” as useful as some fancy indicator that portends to be able to predict the future, in reality it is actually much more useful.
Likewise, also remember that there is no humanly possible way to eliminate occasional whipsaws when using moving averages. So learn to live with it.
Trend-Following Indicators I Have Known and, er, Followed(?)
None of the indicators or methods that I will discuss next will ever pick a bottom or a top. In fact, they may not even really impress you in any way. At least not until you find yourself on the sidelines while the market is powering higher without you on board. So here are a couple of simple trend-following indicators to keep in mind:
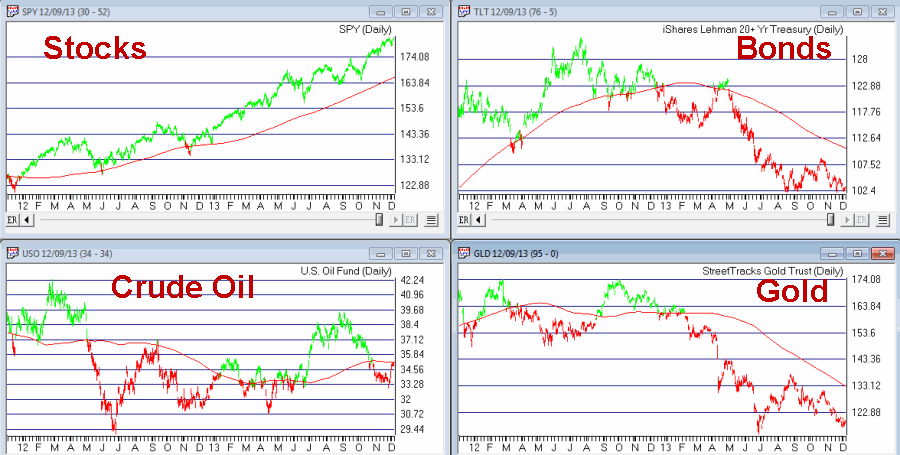
The 200-day Moving Average
OK, this one is so basic and so commonly followed that it gets dismissed by some people. But Figure 1 displays a variety of markets during different time frames. In fact, an investor who simply fought the urge to fight the trend would have enjoyed riding some nice uptrends (particularly in the stock market) and avoided a lot of pain (most notably in bonds and gold).  Figure 1 – Four Markets with 200-day simple moving average (Courtesy: AIQ TradingExpert)
The Bowtie Pattern
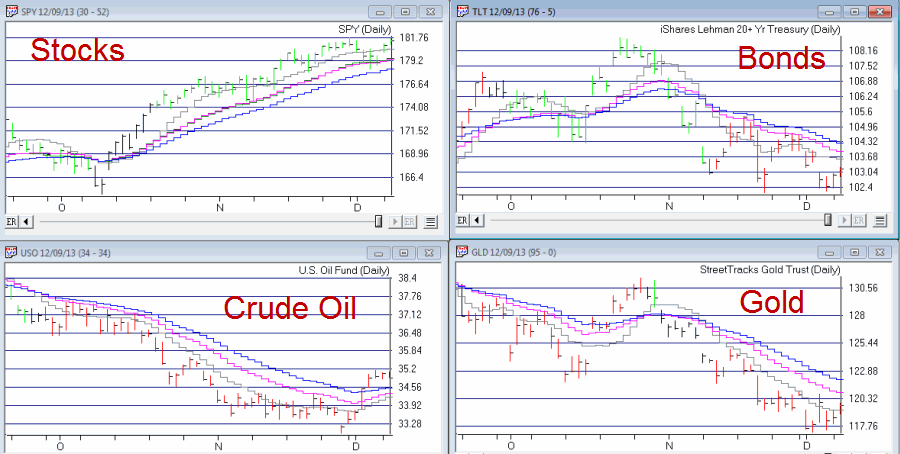
I learned the Bowtie pattern from David Steckler (http://www.etfroundup.com/), who in turn learned it from David Landry (www.davelandry.com). It involves three moving averages:
-10-day simple moving average
-20-day exponential moving average
-30-day exponential moving average
A Bullish signal occurs when the 10-day is above the 20-day and the 20-day is above the 30-day.
A Bearish signal occurs when the 10-day is below the 20-day and the 20-day is below the 30-day.
As usual, different traders use things in different ways. David likes to enter as soon as a new trend emerges, I prefer to look for pullbacks within an established trend. I suggest you explore both possibilities.  Figure 2 – Four Markets with 10-day simple, and 20 and 30-day exponential averages (Courtesy: AIQ TradingExpert)
The 13-55 Exponential Moving Average
OK, at some point one moving average method looks pretty much like every other moving average method. In fact that is actually the case. Linda Bradford Raschke of Market Wizards fame (www.LBRGroup.com) once stated (OK, for the record, I am paraphrasing here) that “there is no one best moving average method, so just pick something and go with it.”
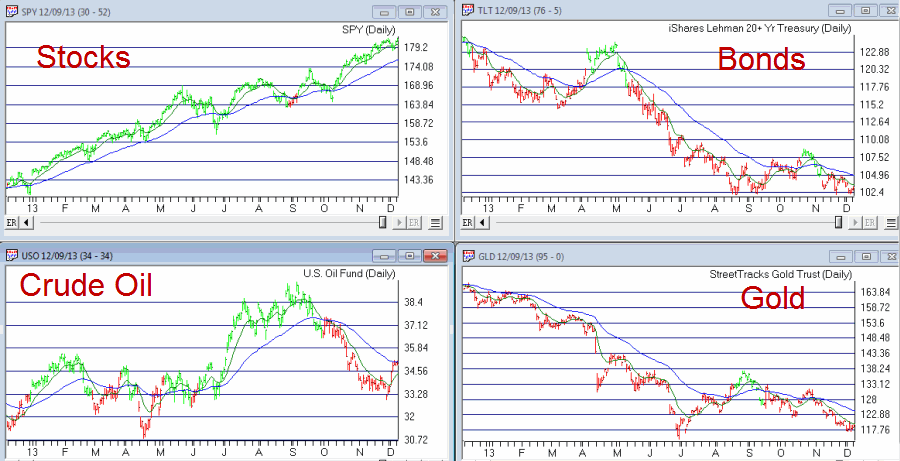
One more combination that I like as an intermediate term guide is the 13-day and 55-day exponential moving average combination as shown in Figure 3.
 Figure 3 – Four Markets with 13-day and 55-day exponential averages (Courtesy: AIQ TradingExpert)
Summary
I encourage you to take a closer look at all of the combinations I’ve mentioned above. Remember two things:
-If you try to use them as Standalone systems (i.e., buying at every bullish signal and selling at every bearish signal) you are likely to be disappointed.
-The real power comes from using methods like the ones I’ve shown to objectively identify the current major trend, and then figuring out ways to trade in line with the major trend.
Jay Kaeppel

