Don’t worry, this story does not involve Russian hookers (nor Blue Dresses). It is still a pretty sordid tale.
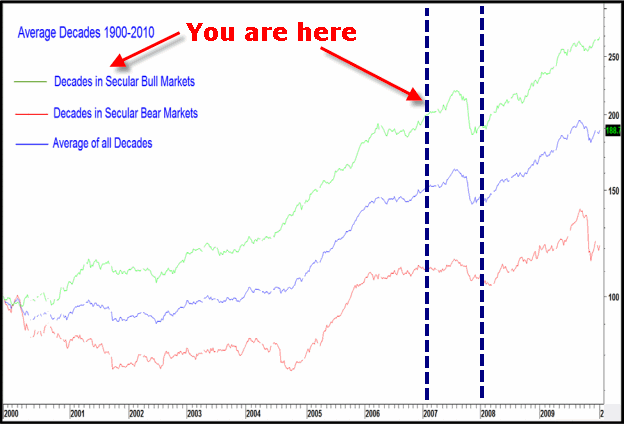
In Months to Beware of in 2017 I included certain months “within Years Ending in 7” as months to be cautious. The “Years Ending in 7” seems pretty obscure but is founded in the “typical” pattern for the stock market across a given decade. Figure 1 below is from something written by Martin Pring in 2009 or 2010. But it shows a chart with the “typical Decennial Pattern” (he draws three lines, one for secular bull markets, one for secular bear markets and one for “All Decades” the blue line in the middle). Note that Years 7 within a secular bull market tend to take a big hit in the 2nd half of the year. Figure 1 – The Decennial Stock Market Pattern (Martin Pring)
(See also The One Asset Class Per Month Strategy)
Note the tendency for a meaningful decline during Year 7. If you click on the link above and scroll down to Page 11 you can see the decade-by-decade results for the Dow. Here is what you’ll find:
Years that witnessed a meaningful decline:
1907
1917
1937
1957
1977
1987
2007
Year that witnessed intermediate-term tops
1947
1967
1997
Years relatively unaffected
1927
Note that 1927 is the only Year 7 that escaped relatively unscathed. So that’s why “Years Ending in 7” was included in Months to Beware of in 2017. Does any of this guarantee a bad year for the stock market in 2017? Not at all. But – referencing my earlier article – the months of February and especially September and October has witnessed alot of stock market mayhem during Years ending in “7”.
Here’s hoping that 2017 will be the exception to the rule.
Jay Kaeppel

