Technology being what it is today, if you want investing to be rocket science, it can be done. You can fill your desk with enough quote screens to resemble NASA mission control back in the day.
(See also Seasonality in the Bond Market? You Bet)
But it sure doesn’t have to be done that way. Consider the following…
A Two-Fund Portfolio for February/March/April
Let’s look at the historical Feb/Mar/Apr performance of this pairing:
*Fidelity Select Energy Services (ticker FSESX)
*Fidelity Select Chemicals (ticker FSCHX)
For our test:
*Put 50% in each fund on the last day of January
*Sell both funds on the last day of April
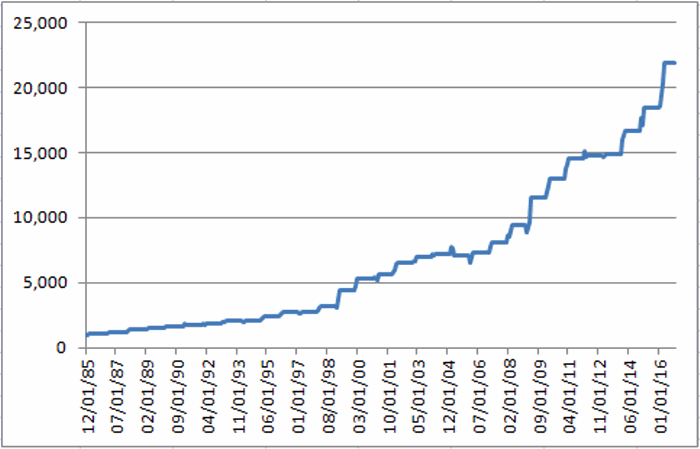
Figure 1 displays the growth of equity using this approach starting in 1986 Figure 1 – Growth of $1,000 split 50/50 in FSESX and FSCHX during Feb/Mar/Apr since 1986
For the record:
*Number of years showing a gain = 28 (90%)
*Number of years showing a loss = 3 (10%)
*Average Gain = +12.1%
*Average Loss = (-1.5%)
*Largest Gain = +40.1% (1999)
*Largest Loss = (-2.2%) (1997)
Figure 2 displays the year-by-year results.
| Year | 3-Month % +(-) |
| 1986 | 5.9 |
| 1987 | 14.6 |
| 1988 | 17.8 |
| 1989 | 7.7 |
| 1990 | 4.9 |
| 1991 | 8.5 |
| 1992 | 4.6 |
| 1993 | 13.7 |
| 1994 | (0.9) |
| 1995 | 15.5 |
| 1996 | 15.0 |
| 1997 | (2.2) |
| 1998 | 17.8 |
| 1999 | 40.1 |
| 2000 | 20.6 |
| 2001 | 5.0 |
| 2002 | 16.5 |
| 2003 | 5.6 |
| 2004 | 3.2 |
| 2005 | (1.3) |
| 2006 | 2.7 |
| 2007 | 11.1 |
| 2008 | 16.9 |
| 2009 | 22.9 |
| 2010 | 12.1 |
| 2011 | 11.9 |
| 2012 | 1.6 |
| 2013 | 1.1 |
| 2014 | 11.4 |
| 2015 | 11.1 |
| 2016 | 18.6 |
Figure 2 – Year-by-Year Results
Summary
This “method” has generated a gain during each of the past 11 years. Is 2017 the year that Murphy’s Law steps up and slaps this simplistic idea across the head? As a guy who has written 3 consecutive articles (the prior two are here and here) extolling the virtues of the energy sector is Feb/Mar/Apr it wouldn’t surprise me a bit.
Jay’s Trading Maxim #206 clearly states: Murphy hates you. Plan accordingly.
(See also January Showdown – Murphy vs. Munis)
So please remember that this blog does not make “recommendations”, it simply relays information. Nothing that appears above should be taken to imply that this simple portfolio is sure to make money during Feb/Mar/Apr of 2017 (Yes, I am invoking the dreaded “Historical performance does not guarantee future results” caveat).
Still, as far as historical results go, I’ve seen worse.
Jay Kaeppel

