Apparently today is “Update Example Option Trade Day” here at JayOnTheMarkets.com. This article is an update of this previous article.
Trading Silver (using options on ETF ticker SLV)
In the initial article I highlighted the fact that as of mid-June the daily Elliott Wave count for ticker SLV (the ETF that tracks the price of silver) was bullish and that the weekly Elliott Wave count for Silver was bearish. Based on nothing more than this (can you say “speculation”?) I highlighted a long straddle using August SLV options that might stand to make money if either of the Elliott Wave projections panned out.
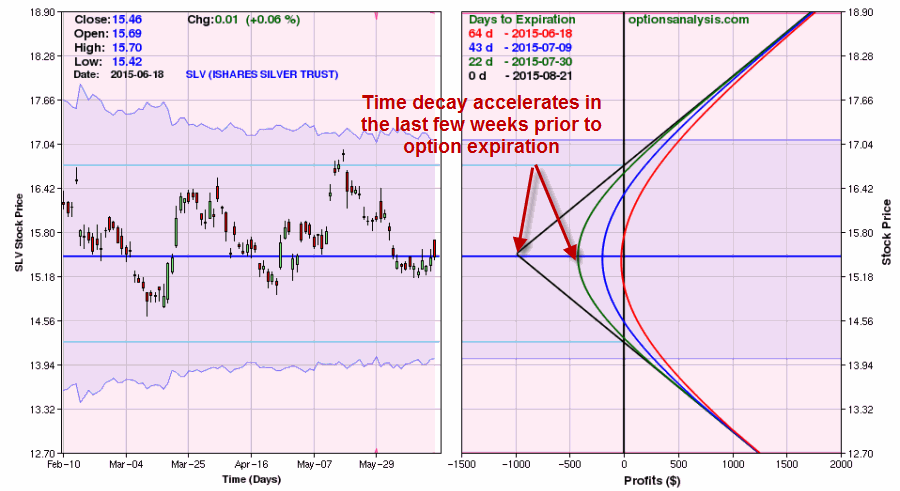
The initial risk graph at the time I wrote about this position initially appears in Figure 1.

 Figure 1 – Initial risk curves for August SLV straddle
The price for ticker SLV has subsequently broken to the downside.
The current risk curves for the August straddle appear in Figure 2. Figure 2 – Risk curves for initial position as of close on 7/7/15
Key Things to Note:
*In general, there are two basic approaches to straddles:
Approach 1: Wait for a trend to develop (or a breakout) and then close the opposite leg and try to ride the winning leg as far as possible.
Approach 2: Set a profit target and if it is hit, sell immediately and take the money and run.
(A third approach involves entering a straddle prior to an earnings announcement and exiting shortly thereafter is another choice. But that approach is a whole separate topic)
*Approach 1 is generally more of a longer-term strategy whereby a trader expects a breakout from a range or chart formation but is, a) not sure which way the breakout will go, and b) expects a decent move in price once the breakout does occur.
*Approach 2 is more of a “hit and run” strategy.
*The primary downside to Approach 1 is that not every breakout follows through in a meaningful way. Therefore, you could enter a straddle, wait for the breakout, exit the losing leg, and then watch price reverse, creating a loss in the remaining leg. Bottom line, you’d better have some reason to be pretty confident that a meaningful trend will follow the expected breakout.
*The primary downside to Approach 2 is a psychological one. Using Approach 2 you could sit with a straddle that is losing a little more money day after day (as time decay eats away at both options while price meanders) – which can drive a lot of traders crazy. And then all of a sudden one day, there is a big price move, the trade hits the profit target and you are out. While that doesn’t sound like (and is not) a bad thing, the reality is that this can be leave a lot of individuals “unsatisfied” as they never got to “ride a winner.”
In other words, people instinctively like to ride a winning trade for awhile because, well, let’s be honest, it feels good. That does not happen if you trade straddles with a set profit target. Either you are:
A) Losing, losing, losing, losing, losing and eventually close the trade with a loss, OR
B) Losing, losing, losing, losing, losing and then suddenly – BOOM – you are out of the trade with a profit, without the psychological gratification that comes with “riding a winner”.
For my own purposes I prefer Approach 2, but it took a long time to get there. As a trader who came to options from a futures trading background, I was “programmed” to “cut losses”. So I would put on a straddle, watch it decay a little day after day, and finally I couldn’t take it anymore and “pulled the plug.” I am sure you can guess what happened in many cases shortly after I got out (BOOM).
What to Do Now
For the record, this is a hypothetical trade intended as an example, so in reality there is nothing to actually “Do Now”. In any event, in the initial article I suggested using the initial Elliott Wave price targets of 17.31 And 13.26 as areas to consider profit taking. While this criteria is reasonable, typically for a long straddle I suggest setting a profit target of 15-20% of the amount paid to enter the trade and exiting the entire position when that level of profit it reached.
For this example trade:
*The cost to enter this particular SLV straddle was $992. So a 20% profit target would be roughly $198.
*This level of profit would have been hit early in the day on 7/7/15 as SLV gapped down from a 7/6 close of $14.99 to $14.56 and then plunged all the way to $14.03.
*Note that price then rebounded and closed at $14.43, so a trader would have had to,
a) act quickly when the profit target level was reached, or,
b) already placed a good-till-cancelled limit order to exit the entire position if the profit level is reached (this means that the trader must do some homework initially and learn how to place unique orders such as this). Figure 3 – SLV gaps down; 20% profit target hit, trade exited, Show’s Over, there’s nothing more to see here folks.…
Jay Kaeppel

