In Part 1, I introduced the Know Trends Index (or KTI) that I wrote about in my book “Seasonal Stock Market Trends. I also noted that stock market performance:
*Tends to be very good when the KTI is greater than or equal to +5.
*Tends to be very bad when the KTI is +1 or less
*Is mostly very good when the KTI is at +2, +3 or +4 – except of course for when it is horrifically bad (-38% drawdown in 1938 and -57% drawdown in 2008).
So the goal this time out is to create a trading strategy that takes all of this into account.
A Seasonal Stock Market Trends Trading Strategy
The KTI for this test will be calculated exactly as spelled out in “Seasonal Stock Market Trends” and has historically ranged from -1 to +8. Because all of the time periods are know in advance (hence the “Known Trends” moniker) the KTI reading for each given day can be calculated ad infinitum into the future.
Trading Rules:
A) If KTI <= +1 – Hold cash (test assumes 1% of interest annually)
B) If KTI >= +5 – Hold Dow Industrials using leverage of 2-to-1
C) If KTI >=+2 and <=+4 AND the Dow Jones Industrials Average is above its 200-day moving average(*) then hold Dow Industrials using no leverage.
D) If KTI >=+2 and <=+4 AND the Dow Jones Industrials Average is below its 200-day moving average(*) then hold cash (test assumes 1% of interest annually).
(*) – There is a one-day lag in measuring Dow versus its 200-day moving average. Allow me to explain:
-Let’s say that it is Tuesday and we know that the KTI reading for Wednesday will be +3. If the Dow closes on Monday above its 200-day moving average (calculated as of the close on Monday) then we will buy (or continue to hold) at the close on Tuesday. If the Dow had closed on Monday below its 200-day moving average we would not have entered a new position on Tuesday (or if we were already in a position we would sell it on Tuesday because the Dow was below its 200-day moving average and the KTI was less than +5).
We will start our test on 12/31/1934. When a long position is held we will assume that we gain or lose the daily percentage change for the Dow Jones Industrials Average
Random Notes regarding Results:
*This is a “long-term” method. When I say “long-term” I am not referring to holding period as much as I am referring to the fact that an investor needs to let this method work over an extended period of time in order to derive the benefits.
*This method makes money by “grinding it out” – i.e., by making an above average return when using leverage, by tracking the market when long but not using leverage, and missing a lot of the “pain” by being out of the market during certain unfavorable periods.
*Year-to-year results should not be focus. In other words, some years the ystem will outperform buy and hold and other years it will not. What really matters is long-term rolling rates of return.
OK, with all that out of the way, let’s look t the actual results.
Results
The short version is this:
*The average annual return for the Seasonal System is +15.8%
*The average annual return for Buy-and-Hold is +8.0%
(these results reflect price only plus interest earned while in cash, no dividends)
Now a funny thing happens when you compound returns over a long period of time. So for the record:
*$1,000 invested in the Dow using buy and hold since 12/31/1934 grew to $175,240
*$1,000 invested using the seasonal system since 12/31/1934 grew to $40,402,501
Like I said, compounding at a higher rate of return really adds up over long periods of time.
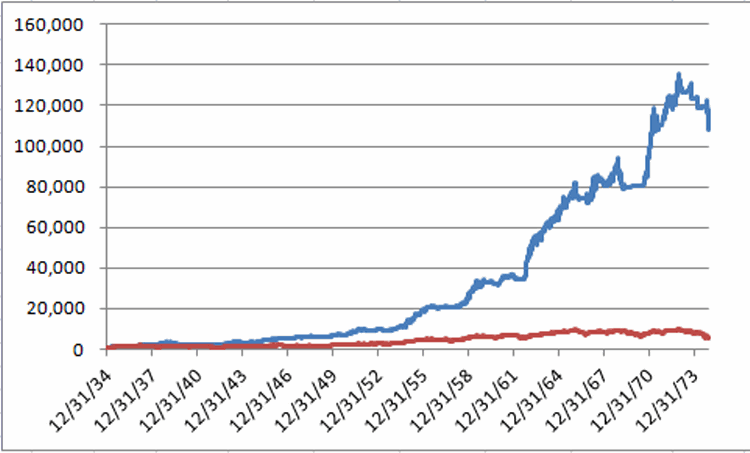
To better illustrate the results over time let’s look at two separate roughly 40 year periods. Figure 1 shows the growth of $1,000 for the Seasonal System versus Buy and Hold from 12/31/1934 through 12/1/1974. Figure 1 – Growth of $1,000 invested using Seasonal System(blue line) versus Buy-and-Hold (red line); 12/31/1933-12/31/1974
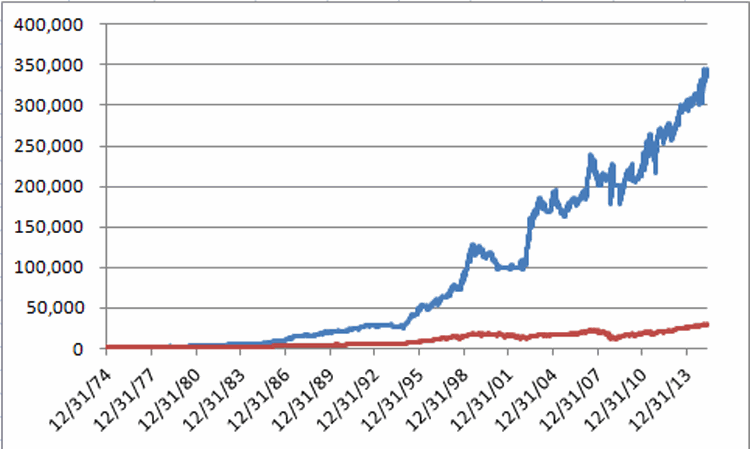
Figure 2 shows the growth of $1,000 for the Seasonal System versus Buy-and-Hold from 12/31/1974 through 5/22/2015. Figure 2 – Growth of $1,000 invested using Seasonal System(blue line) versus Buy-and-Hold (red line); 12/31/1974-5/22/2015
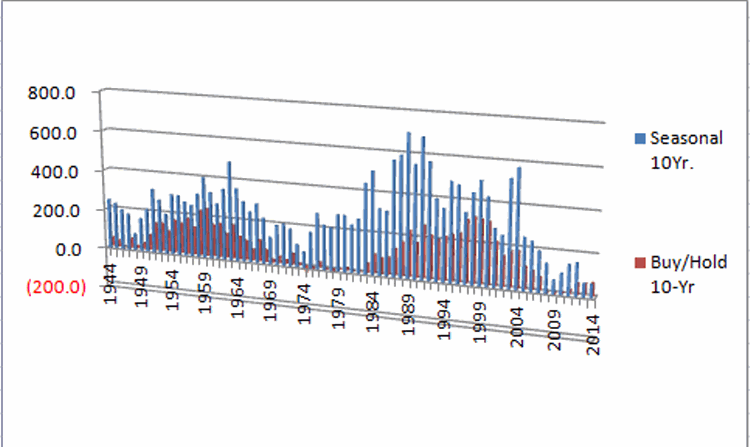
Figure 3 shows the rolling 10-year returns for the System versus buy and hold. Figure 3 – Rolling 10-Year returns for Seasonal System (blue bars) versus Buy-and-Hold
The bottom line is this: Rolling 10-year returns for the Seasonal System have outperformed Buy-and-hold 70 out of 71 times. In other words, starting at the end of 1944, if you looked back at the performance over the prior 10 years, the Seasonal System outperformed Buy-and-Hold 70 times. Buy-and-Hold outperformed the Seasonal System one time.
As I am wont to say, ratios like 70-to-1 are something we quantitative analyst types refer to as “statistically significant.”
Finally, Figure 4 shows the year-by-comparative results.
| Year | Seasonal | Buy/Hold | Difference |
| 1935 | 46.4 | 38.5 | 7.9 |
| 1936 | 22.9 | 24.8 | (1.9) |
| 1937 | 13.0 | (32.8) | 45.8 |
| 1938 | 67.4 | 28.1 | 39.3 |
| 1939 | (26.2) | (2.9) | (23.3) |
| 1940 | (7.3) | (12.7) | 5.4 |
| 1941 | (1.5) | (15.4) | 13.9 |
| 1942 | 17.8 | 7.6 | 10.2 |
| 1943 | 19.9 | 13.8 | 6.0 |
| 1944 | 8.0 | 12.1 | (4.1) |
| 1945 | 39.2 | 26.6 | 12.6 |
| 1946 | 11.6 | (8.1) | 19.7 |
| 1947 | 6.6 | 2.2 | 4.3 |
| 1948 | 8.4 | (2.1) | 10.6 |
| 1949 | 6.5 | 12.9 | (6.4) |
| 1950 | 10.6 | 17.6 | (7.0) |
| 1951 | 30.8 | 14.4 | 16.5 |
| 1952 | 3.5 | 8.4 | (4.9) |
| 1953 | (2.7) | (3.8) | 1.0 |
| 1954 | 44.9 | 44.0 | 1.0 |
| 1955 | 38.6 | 20.8 | 17.9 |
| 1956 | 3.4 | 2.3 | 1.1 |
| 1957 | 2.7 | (12.8) | 15.5 |
| 1958 | 26.7 | 34.0 | (7.3) |
| 1959 | 28.3 | 16.4 | 11.9 |
| 1960 | (5.2) | (9.3) | 4.2 |
| 1961 | 14.5 | 18.7 | (4.3) |
| 1962 | 24.4 | (10.8) | 35.2 |
| 1963 | 26.6 | 17.0 | 9.6 |
| 1964 | 13.4 | 14.6 | (1.1) |
| 1965 | 20.2 | 10.9 | 9.3 |
| 1966 | (8.9) | (18.9) | 10.0 |
| 1967 | 15.0 | 15.2 | (0.2) |
| 1968 | 4.8 | 4.3 | 0.5 |
| 1969 | (7.2) | (15.2) | 8.0 |
| 1970 | 20.0 | 4.8 | 15.2 |
| 1971 | 18.1 | 6.1 | 12.0 |
| 1972 | 15.7 | 14.6 | 1.1 |
| 1973 | (6.1) | (16.6) | 10.5 |
| 1974 | (4.6) | (27.6) | 23.0 |
| 1975 | 87.9 | 38.3 | 49.5 |
| 1976 | 22.3 | 17.9 | 4.5 |
| 1977 | (1.5) | (17.3) | 15.8 |
| 1978 | 1.9 | (3.1) | 5.1 |
| 1979 | 12.1 | 4.2 | 7.9 |
| 1980 | 20.2 | 14.9 | 5.3 |
| 1981 | 5.0 | (9.2) | 14.3 |
| 1982 | 26.1 | 19.6 | 6.5 |
| 1983 | 39.3 | 20.3 | 19.0 |
| 1984 | 6.2 | (3.7) | 9.9 |
| 1985 | 32.8 | 27.7 | 5.2 |
| 1986 | 19.7 | 22.6 | (2.9) |
| 1987 | 56.3 | 2.3 | 54.0 |
| 1988 | 6.0 | 11.8 | (5.9) |
| 1989 | 29.5 | 27.0 | 2.6 |
| 1990 | (1.8) | (4.3) | 2.5 |
| 1991 | 26.2 | 20.3 | 5.9 |
| 1992 | 7.8 | 4.2 | 3.7 |
| 1993 | 3.8 | 13.7 | (10.0) |
| 1994 | (3.0) | 2.1 | (5.1) |
| 1995 | 71.0 | 33.5 | 37.6 |
| 1996 | 16.9 | 26.0 | (9.1) |
| 1997 | 21.5 | 22.6 | (1.2) |
| 1998 | 28.9 | 16.1 | 12.8 |
| 1999 | 43.9 | 25.2 | 18.7 |
| 2000 | (13.7) | (6.2) | (7.5) |
| 2001 | (8.6) | (7.1) | (1.5) |
| 2002 | (0.4) | (16.8) | 16.4 |
| 2003 | 82.8 | 25.3 | 57.5 |
| 2004 | 5.2 | 3.1 | 2.0 |
| 2005 | (9.9) | (0.6) | (9.3) |
| 2006 | 11.7 | 16.3 | (4.6) |
| 2007 | 6.6 | 6.4 | 0.1 |
| 2008 | 5.5 | (33.8) | 39.3 |
| 2009 | 0.1 | 18.8 | (18.7) |
| 2010 | 3.6 | 11.0 | (7.5) |
| 2011 | 11.6 | 5.5 | 6.1 |
| 2012 | 4.4 | 7.3 | (2.9) |
| 2013 | 17.8 | 26.5 | (8.7) |
| 2014 | 4.9 | 7.5 | (2.7) |
| Average | 15.8 | 8.0 |
Figure 4 – Year-by-Year Results for Seasonal System versus Buy-and-Hold
Summary
See Part 3 to follow….
Jay Kaeppel


I linked this article to a review on amazon that said you left the year 2008 out of the backtest in the book
Steve, Actually the book came out in early 2008, so it wasn’t “left out” it just hadn’t happen yet. For the record the KTI strategy detailed in the book took a beating in 2008 (mostly during readings of +3 and +4 during September/October). Murphy’s Law strikes again. For the record, I mostly pay attention to readings of +5 or more and also 0 and +1. Jay