In case you were not aware of it, I have a “thing” for seasonal trends. Certain commodities are especially well known for exhibiting “seasonal” – or “cyclical”, if you prefer – trends. I’ve talked a bit recently about crude oil and energies here and here.
Another market that fits the bill is Soybeans. Specifically beans have a tendency to show strength between early February and mid-June.
The Test
Even more specifically we will look at soybean performance as follows:
*From the close on the 8th trading day of February through the close on the 15th trading day of June since 1978.
Technical Note: The data that I am using or this test is based on a “continuous” contract which strings together the “front month” (i.e., most heavily traded) over time. Essentially this data base simply captures the dollar value of the daily price change for the “front month” soybean futures contract and strings them together.
Also, commodity pricing and contract values can cause one to have a headache. To wit: Soybean futures contract are priced in dollar and sense for 50,000 bushels of soybeans. So each $0.01 (one cent) move in the price of a bean contract is worth $50. If soybeans advance from $8.00 a bushel to $9.00 a bushel, then the value of the contract increases by $5,000 ($50 a cent x 100 cents). Is this commodity trading stuff exciting, or what?
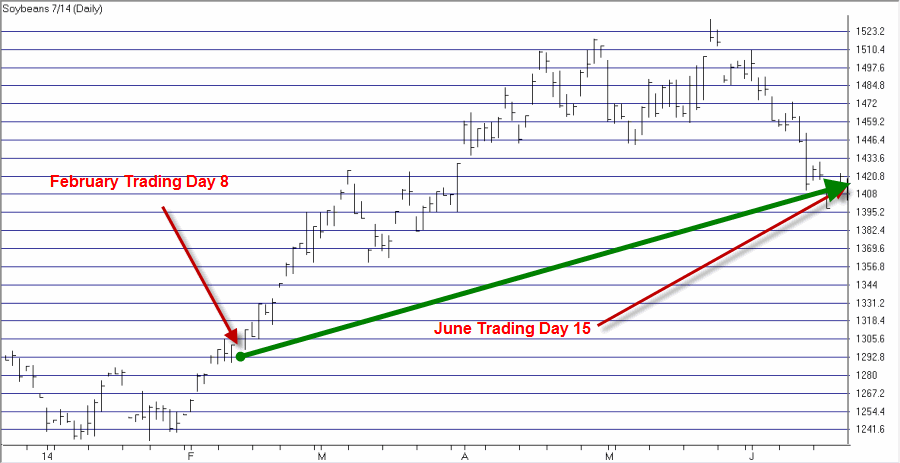
Figure 1 displays the July 2014 Soybean contract. Figure 1 – July 2014 Soybeans
The good news is that if a trader had bought soybeans in February 2014 and sold them in June 2014 he would have made a nice profit. The bad news – as you can see on the far right hand side of the chart starting in around late May – is that he made a lot more money before giving a good chunk back in early July.
And this raises an important point: No one is suggesting that this be used as a mechanical approach to trading. Well, OK, not unless you can answer “Yes” to the following three questions:
- Are you already ridiculously wealthy?
- Do you understand the meaning of the phrase “small lot size”?
- Do you know how to place a stop-loss order?
If you can answer “Yes” to the three questions above you are free to trade this method mechanically (although for the record I am not making a recommendation here, just highlighting an “interesting” trend).
Everybody else – well at least anyone else who is inclined to and willing to trade soybean futures – might consider the idea of looking for buying opportunities within this favorable time frame, rather than simply buying and holding.
Still, to get the idea of how useful this information might be let’s go back to our mechanical approach and consider…..
The Results
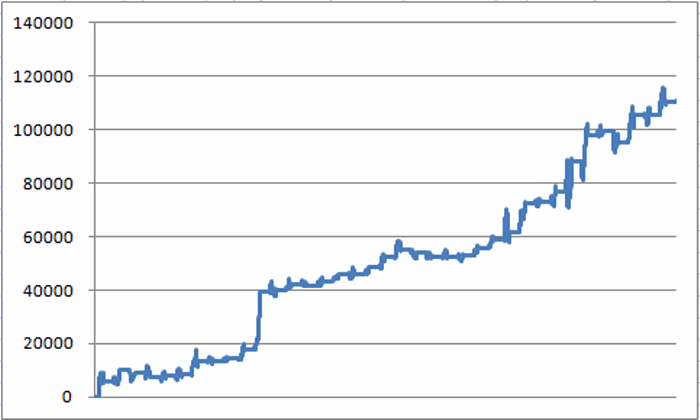
Figure 2 displays the (hypothetical) equity curve generated by holding a long position of 1 contract of soybeans during the seasonally favorable February into June period since 1978. Figure 2 – Equity curve of long 1 soybean contract during seasonally favorable period
Figure 3 displays the year-by-year results. I need to repeat here that these numbers were generated by buying March soybeans, then selling that contract in late February and buying the May contract and then selling the May contract in late April and buying the July contract (no seriously, is this commodity trading stuff exciting, or what?).
So I make no claim that these numbers are exactly what a trader would have experienced in real-time trading. Also, there is no slippage or commissions deducted. The purpose of this exercise is not so much to highlight the “raw dollars” but rather the fairly consistent persistence of the favorable trend within the annual time frame.
| End of Period (YYMMDD) | $+(-) | Cumulative |
| 0 | ||
| 780621 | $5,813 | $5,813 |
| 790621 | $4,438 | $10,250 |
| 800620 | ($1,375) | $8,875 |
| 810619 | ($1,288) | $7,588 |
| 820621 | $119 | $7,706 |
| 830621 | $769 | $8,475 |
| 840621 | $5,150 | $13,625 |
| 850621 | ($63) | $13,563 |
| 860620 | $656 | $14,219 |
| 870619 | $3,600 | $17,819 |
| 880621 | $21,744 | $39,563 |
| 890621 | $306 | $39,869 |
| 900621 | $1,994 | $41,863 |
| 910621 | ($244) | $41,619 |
| 920619 | $1,713 | $43,331 |
| 930621 | $2,650 | $45,981 |
| 940621 | ($75) | $45,906 |
| 950621 | $2,469 | $48,375 |
| 960621 | $3,781 | $52,156 |
| 970620 | $3,106 | $55,263 |
| 980619 | ($1,350) | $53,913 |
| 990621 | ($1,281) | $52,631 |
| 621 | ($238) | $52,394 |
| 10621 | $463 | $52,856 |
| 20621 | $3,006 | $55,863 |
| 30620 | $3,294 | $59,156 |
| 40622 | $2,544 | $61,700 |
| 50621 | $10,919 | $72,619 |
| 60621 | $363 | $72,981 |
| 70621 | $3,856 | $76,838 |
| 80620 | $11,200 | $88,038 |
| 90619 | $10,050 | $98,088 |
| 100621 | $1,288 | $99,375 |
| 110621 | ($4,163) | $95,213 |
| 120621 | $10,475 | $105,688 |
| 130621 | ($125) | $105,563 |
| 140620 | $4,638 | $110,200 |
Figure 3 – Soybeans (approximate) Year-by-Year during Feb-June seasonally favorable period (1978-2015); Includes roll overs from one contract month to another along the way
For the record, during the seasonally favorable period for soybeans:
*Up 27 times (73% of the time)
*Down 10 times (27% of the time)
*Average gain during Up years = +$4,459
*Average loss during Down years = -$1,020
*Two biggest Up years = +$21,744 (1988) and +11,200 (2008)
*Two biggest Down years = -$4,162 (2011) and -$1,375 (1980)
In a nutshell, this period has seen beans rise 2.7 times more often than they decline and the average win/loss ratio is almost 4.4-to-1. These are values that we highly trained quantitative analyst types often refer to – using our highly technical quantitative jargon – as “pretty darn good.”
For the record the favorable period for beans in 2015 already started at the close of trading on 2/11/15. During the first two days of this time frame March beans were up 12.75 cents (+$637.50). May beans were up 14 cents ($700) and July beans were up 14.25 cents ($712.50).
So far so good? OK, I have to admit its a little early for that.
Summary
So should everyone be rushing to buy soybeans before the “train leaves the station.” Surely not. First off, let’s be honest – most people will never trade soybeans futures, nor should they. Still, as those who like to drop clichés every once in awhile to try to make themselves look smarter than they actually are (“Hi, my name is Jay”) just remember that “Knowledge is Power.” For the record, at this point you now know more about how to make money trading soybeans than a lot of the people who currently do trade them.
One last note, although it is very thinly traded there is an ETF that tracks the price of Soybeans (ticker SOYB). Those not inclined to trade futures contracts might take a look at buying shares of this ETF (did I mention that it is very thinly traded?)
Jay Kaeppel


2 thoughts on “It “Bean” a Good Time of Year”
Comments are closed.