Some trading strategies make intuitive sense. Other trading strategies do not. With some trading strategies it is possible to articulate some logical reason or reasons regarding why they might be expected to work well over time. With others trading strategies, well, not so much.
Some trading strategies lend some confidence to a trader. Others offer nothing but a ridiculously good historical track record – and require a trader to make a leap of faith.
For example, consider the following seasonal trading strategy.
The Rules
*On the last trading day of January buy Energies (FSESX)
*On the 1st trading day of May sell Energies
*On the 7th trading day of August buy Biotech (FBIOX)
*On the 9th trading day of September sell Biotech
*On the 19th trading day of October buy Retail (FSRPX)
*On the 20th trading day of November sell Retail
The rest of the time the portfolio is held in cash. For the purposes of this test we will assume that the portfolio earns interest at a rate of 1% per year while in cash.
The Results
We will start our test on 12/31/1988. But before we look at the results of our “system” (such as it is), let’s first create something to compare it to. So for our “comparative result” we will split $1,000 evenly between:
Fidelity Select Energy Services (FSESX)
Fidelity Select Biotechnology (FBIOX)
Fidelity Select Retailing (FSRPX)
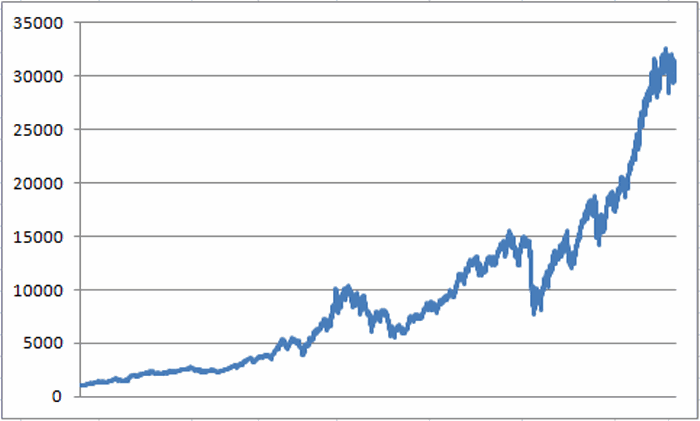
At the end of each year we will rebalance so that each year all three funds start with 1/3 of the portfolio. The daily equity curve for this 3-fund buy-and-hold approach (with an annual rebalancing adjustment) appears in Figure 1.  Figure 1 – Growth of $1,000 in FSESX/FBIOX/FSRPX from 12/31/88 to 12/31/14 (rebalanced annually)
In a nutshell, $1,000 invested this way grew to $31,165 by the end of 2014. This works out to about a +16.3% annual return, which in the technical financial jargon that we “highly trained quantitative analyst” types like to use, “ain’t too shabby.” Of course a close look at Figure 1 reveals some pretty nasty swings along the way. But hey, you “gotta take the good with the bad”, right?
Well, possibly “not.”
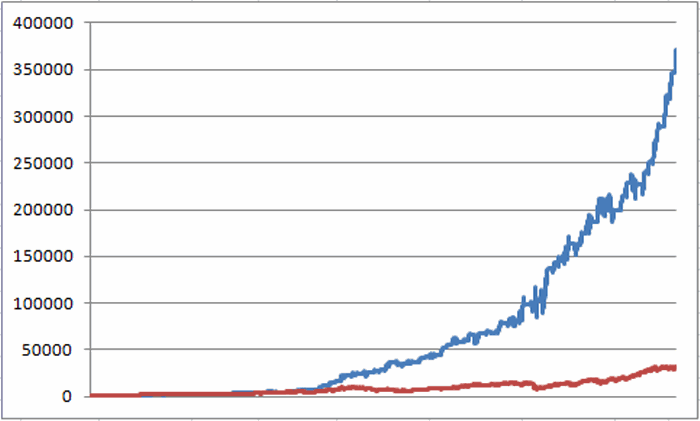
Now let’s look at the results generated following the switching rules listed earlier. The growth of $1,000 invested using this method since the end of 1988 appears in Figure 2 (the blue line). For comparison sake, the results we generated using the buy and hold approach is also displayed in Figure 2 (the red line).  Figure 2 – Jay’s Seasonal System (blue) versus 3 fund buy-and-hold (red); 1988-2014
Despite the fact that you may not be a “highly trained quantitative analyst” type, chances are good that even your untrained eye can pick up on the fact that there is a “discrepancy” between the blue line and the red line in Figure 2.
For the record:
-$1,000 invested using the buy-and-hold approach detailed earlier grew to $31,165, or +3,016% (+16.3% annually).
-$1,000 invested using the seasonal trading rules listed earlier grew to $347,003, or +34,600% (+26.7% annually).
In still more highly technical financial jargon, these types of 11.5-to-1 discrepancies in return are what we refer to as “statistically significant.”
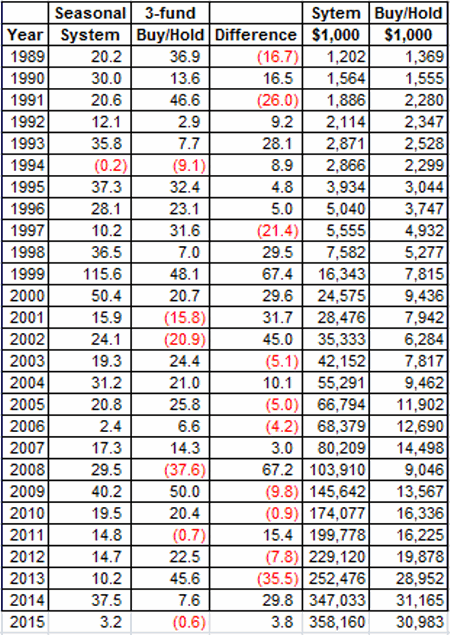
The annual results for both methods are listed in Figure 3. Figure 3 – Annual
figure 3 – Results: Jay’s Seasonal System versus Buy-and-Hold (thru 2/4/2015)
A few interesting numbers: Figure 4 – A few relevant comparative numbers
Other Choices
Fidelity sector funds are not the only choices. Other possible candidates:
XLE Energy Select Sector SPDR (ETF)
IBB iShares Nasdaq Biotechnology (ETF)
XRT SPDR S&P Retail (ETF)
OEPIX ProFunds Oil Equipment (x1.5 leveraged)
BIPIX ProFunds Biotechnology UltraSector (x1.5 leveraged)
CYPIX Profunds Consumer Cyclical (x1.5 leveraged)
Summary
So should every investor simply stop what they’re doing now and just make these three trades every year and sit back and collect their 26%+ per year ad infinitum into the future?
Well it sounds good in theory, but of course the reality – as is the case with any seasonal trend – is that there is no guarantee that these trends will play out as consistently or as strongly in the future as they have in the past.
Which is where the “leap of faith” I mentioned earlier enters into the picture and leads most traders to stand on the “outside looking in.” And maybe that is the wise thing to do.
Still, 26% is 26%. Or to quote the immortal words of Glenn Frey: “The lure of easy money – it’s got a very strong appeal.”
Jay Kaeppel


It would be great to discover what’s behind this really strong seasonal behaviour, it has been lasting so much that some fundamental factors may be the causing it.
https://nightlypatterns.wordpress.com
Jay,
Thanks for this reminder. I know I’ve seen this system before and I remember Hulbert reviewing it.
Do you know who the original author is? Thanks, j
Jim, Thanks for the comment. For the record this particular version is based on my own research. Lot’s of similar ideas out there though, some probably better, some probably worse. Jay
When was this trading system first discovered?
There was another seasonality trade for FSESX that had a great record starting in 1985 (up 23 straight years), but only so-so for the last few years:
Buy FSESX last day in November
Sell FSESX last day in May
George, I did alot of research on sector seasonality, most of it based on data from 1988 through the end of 2003. Can’t tell you exactly when I devised this one but the results are “out of sample” since 12/31/03. The good news: 11 years of out good of sample performance. The bad news: still no guarantees regarding the future. Jay
Wonderful article….
Too complicated to worry about the middle of the month dates. And perhaps too over-fitted.
Hold FRESX Jan (held over from previous Dec. , sell on last Trading day of January)
Hold FSESX Feb, March April (Buy on last trading day of January, sell on last Trading day of April)
Hold FRESX May June July (Buy on last trading day of April , sell on last Trading day of July)
Hold FBIOX August September (Buy on last trading day of July, sell on last Trading day of Sep.)
Hold FSRPX Oct Nov (Buy on last trading day of Sep, sell on last Trading day of Nov)
Hold FRESX Dec (Buy on last trading day of Nov, hold thru Jan next year)
1989 30.71%
1990 12.85%
1991 42.83%
1992 29.85%
1993 50.85%
1994 12.04%
1995 42.14%
1996 59.04%
1997 33.95%
1998 31.13%
1999 71.38%
2000 91.24%
2001 15.17%
2002 30.23%
2003 20.75%
2004 42.44%
2005 16.35%
2006 15.48%
2007 2.55%
2008 -10.37%
2009 21.35%
2010 25.74%
2011 12.16%
2012 23.87%
2013 12.18%
2014 52.44%
2015 13.22%
$1000 becomes $786000.
Gregor, this is awesome! Thank you for posting it. Jay
very nice Gregor…some questions…why 3 separate trades for FRESX when it is bought on the last trading day of November and held continuously till the end of July. Is each position 1/3 of total capital with the other 2/3 in cash or is 100% invested at inception then rolled to the next fund….Great Work
JAY,
Awesome indeed, however, I can’t find these symbols to backtest.
Where can I go to backtest and see the results? I was trying at Think or Swim – ThinkBack but didn’t have the option to Buy Stock also with Option ANalysis.
Thanking you in advance.
These are mutual fund symbols: FBIOX is Fidelity Select Biotech, FSESX is Fidelity Select Energy Services and FSRPX is Fidelity Select Retailing. Jay
Good work …. One could also apply a multi-variable risk mitigation process to this format : https://docs.google.com/spreadsheets/d/1vwlCNiIR_OnDmDyxalYaBjJM-gB-Q9CuEupu6k2aSBQ/edit?usp=sharing
Gregor
Though I did get good results, they were not quite what you got. I painstakingly ran the numbers using the adj close for each fund as posted on yahoo and ran 5 trades a year in the order you stated. I had a $1000 turn into $164000 which is still 3x better than holding any one of the four individual funds for that same time period. (holding biotech from 1989 to 2014 gets you about $48000 (retail 33k) (real estate 18k) (energy 9K)
Some stats
85 winning trades –avr 10%/win –best win 58%
45 losing trades–avr 6%/loss–worst lose 36%
I see that you included real estate into the mix. Does this assume rebalancing at the end of the year too?
Tuhin, For this particular strategy there is no rebalancing per se as it holds the entire portfolio in only one fund (or cash) at a time. Jay
Amazing. FSESX (in both Jay’s and Gregor’s system for Feb) is already up almost 7% in February !
Ok I’ve read this. You can delete it now so no one else ever sees this. 🙂
But seriously, this is pretty cool.
Great stuff ! thanks
I put the 3 ETFs (XLE,IBB and XRT) on an excel sheet and ran the numbers. They were very good but I did see a major discrepancy.
In 2007 FSRPX lost 2.8% for the time period you specify while XRT (which is the ETF equivalent) lost 6.5%
In 2008 FSRPX lost 2.3% while XRT lost 16.3% !!! Didn’t expect to see such a difference.
Those are the only two I checked as far as ETFs matching their mutual fund equivalent.
Excellent observations, do raise a few points.
1) XRT tracks an index while FSRPX is actively managed. Fidelity does do a good job in terms of beating sector indexes (generally speaking). The one problem is that Fidelity is a little militant about trades that may not last at least a month or so). But the main point here is that there can be major discrepancies from time to time.
2) In 2008 November only had 19 trading days. So technically (and I did not think to mention this in the original blog post) the exit date in this case would have been the last trading of November and not the 20th day after the trade was entered (December 1, 2008 which saw XRT plummet).
3) Verifying the ETF numbers before using this (or any mechanical system) quoting system results using another vehicle (in this case Fidelity Section funds) is a wise move in terms of understanding expectations.
4) It may also be quite worthwhile to check out the results using the Profunds sector funds listed in the article.
Jay
However fascinating this sounds, as soon as i start checking the facts for myself the numbers already start disappointing. In 2014 using your seasonal method FSESX returned 9.45%, FBIOX 8.01%, and FSRPX 8.72%. As best i can tell the cumulative return was 28.52%. Far short of the 37.5% that is claimed in your chart for 2014. Did i miss something or did you miss something? I would love for this to work, but i need facts. Thanks
Josh, thanks for the post. Under the category of “using price data from sources believed to be accurate” here’s what I have for 2014. First, 1% of annual interest is assumed while out of the market.
Starting with $1,000 on 12/31/13. By January 31st = $1000.84.
Bought FSESX at $69.88, sold at 79.67 for a gain of 14.01% equals $1,141.06.
By 8/8/14 gains 0.27% interest to $1,144.21.
Bought FBIOX at $177.414, sold at $195.59 for a gain of 10.25% equals $1,261.46.
By 10/27 gains 0.124% to $1,2603.08.
Bought FSRPX at $80.74, sold at $87.79 for a gain of 8.73% to $1,373.31.
Interest earned to end of year equals +0.088% to $1,374.52, which gets rounded to +37.5%.
For better or worse, that’s how the +37.5% value for 2014 was arrived at. Jay
Are you sure that difference is statistically significant? The standard deviations seem quite large and the sample size is only 26.
Did you run the 2015 results?
2015 = +23.6%
2016 (thru 3/30) = +6.9%
Jay, I came here after listening to your podcast. I am a systematic trader like yourself with a diversified set of strategies (mostly momentum / mean reversion types but not too much in seasonality types). I found this script quite interesting and seems to fit my other strategies well. One thing I would like to ask: the specific dates that you use intra month, are they data mined recently or are they what you have been using since 2003? It would give me much more confidence if they are not mined recently.
Separately I found improved results by adding two features to your idea:
1. Volcapping; I multiple weights by something along the lines of Min(1, Volcap/HV) to get consistency across underlyings and times
2. Adding bonds–I calculate the bond positions (like TLT) required to make the portfolio 60/40 whenever it is not sitting in cash
In all candor I cannot state exactly when I started following this. But it has been at least 5 years of “real-time” with no changes to the “methodology” (such as is it…). Jay
Jay,
Thanks for clarifying the rebalancing strategy following Gregor’s comment. I did some research on sector monthly returns myself, and used Gregor’s sector funds to come up with this strategy:
Real estate hold months – December
Energy hold months – Feb, April, May
Biotech hold months – January, June, July, Aug, Sep
Retail hold months – March, October, November.
Using the same period as in your analysis, $1000 grows to $2,162,255 by end of 2015, giving a CAGR of ~32%.
This indeed yields excellent performance for 1990-2015.
Unfortunately, YTD its has gone down by over 20% as far as I can tell, whereas holding FRESX in January, FSESX in February thru April and FRESX since May 1 of this year as per my comment above has returned 23% YTD.
Gregor, just to clarify, hen you talk about YTD being down over 20% you are referring to another idea posted in the comments and not the actual article. The system detailed in the original article was long FSESX from close on 1/29 through close on 5/2 and is up +19% for the year. Jay
Yes, I was referring to Tuhin Rukshit’s strategy above, which has, apart from the YTD performance, much to recommend itself.
YTD Result:
Gregor: 34.8%
Rukshit: -18.9%
There is one wrinkle in my strategy: FRESX has to be held for 3 months to avoid the 0.75% penalty. However, the one of the holding periods for FRESX is Dec. and January. To avoid the penalty one can invest , for example, in RQI (with $16 (two-way) transaction fee at Fidelity. That would have returned 38% this year YTD.
Does anyone know how to get the historical monthly (or daily) returns for Fidelity funds?
Keith
Can we use Vanguard funds to get the same results? If yes , which ones? Any updates on the results so far
Have to be careful with Vanguard funds as they usually have switching restrictions (in some cases 60 days or 90 days) which would make them unusable for this strategy. ETFs, Profunds, Rydex are alternatives. Jay
2016 Results:
Gregor 41.3% (with FRESX) 48.5% (with RQI)
Jay 21%
Rakshit -15%
Jay, FSESX took a big hit. I hope that we can get it back on the next trade. Thanks
FSESX took a big hit. Jay, good luck on the next trade.