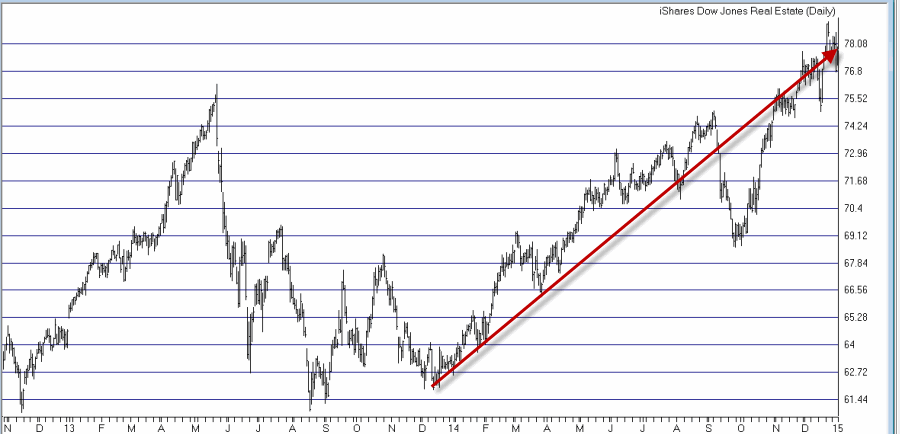
This title implies that perhaps I am talking about the fact that real estate stocks have been performing quite well of late. As you can see in Figure 1, since bottoming in December 2013, the most heavily traded real estate ETF – ticker IYR – is up over 25%. And that is a good thing. Figure 1 – Real Estate ETF Ticker IYR (Courtesy: AIQ TradingExpert)
But the most recent rally is not what I am talking about. I am referring more to what goes on “under the hood.”
As you may know if you (WARNING: Shameless Self-Serving Plug to follow) read my book “Seasonal Stock Market Trends”, I have a “thing” for seasonality in the financial markets. And I also understand that this is also not everyone’s “cup of tea.” Depending on one’s point of view seasonal trends can either be considered to be
a) Interesting and potentially useful, OR;
b) Data curve-fitting to the nth degree
Personally I choose a), but you may choose b). And that’s OK because if we reach the point where we all trade and invest the same then there won’t be anybody left to take the other side of our trades.
The Gist of Seasonal Trends
For the record, the underlying reason that I look at seasonal trends is to attempt to find an “edge.” I would guess that 90% of traders and investors look at fundamental and/or technical analysis. I would guess that no more than 10% of traders and investors look at seasonal trends. So my rhetorical question of the day is:
If you are looking for an edge in the markets does it make sense to look:
a) Where everyone else is looking, OR;
b) Where hardly anyone else is looking?
Again, the choice is yours.
The Best Days for Real Estate
For the following illustration of using seasonal trends we will use ticker REPIX, which is the Profunds Real Estate mutual fund. For the record, this fund uses leverage of 1.5-to-1. For those who want less risk – and are willing to settle for less return – there is the Rydex real estate mutual fund (ticker RYRIX) and many real estate ETFs – with ticker IYR being the most heavily traded.
The Strategy – We will hold ticker REPIX on the following trading days each month:
*The first two trading days of the month
*Trading day’s #8, 12 and 15
*The last four trading days of the month
Obviously this particular strategy is only for traders who are “hands on” and willing to hold positions for either 1 day (in the case of trading days 8, 12 and 15) or 6 days (the four end of month days plus the two start of the next month days). Once again, this is obviously not everyone’s “cup of tea.” Still, the results are fairly compelling.
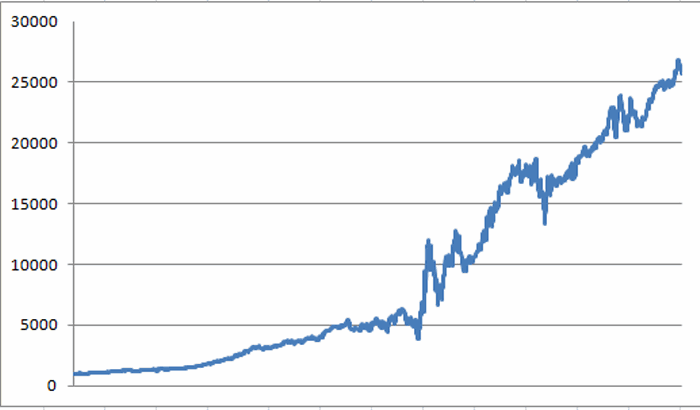
Figure 2 displays the growth of $1,000 invested in ticker REPIX only during the days listed above starting on the August 8, 2000 (when REPIX started trading). Figure 2 – Growth of $1,000 invested in REPIX during “Best Days” (Aug 2000-present)
For the record, $1,000 invested this way grew to $25,694. Now some people will look at the return and say “hmm, that look pretty good.” Others will look at the chart itself and say “Wow, that looks way to volatile.” But looking at a set of returns in a vacuum makes it hard to really judge things.
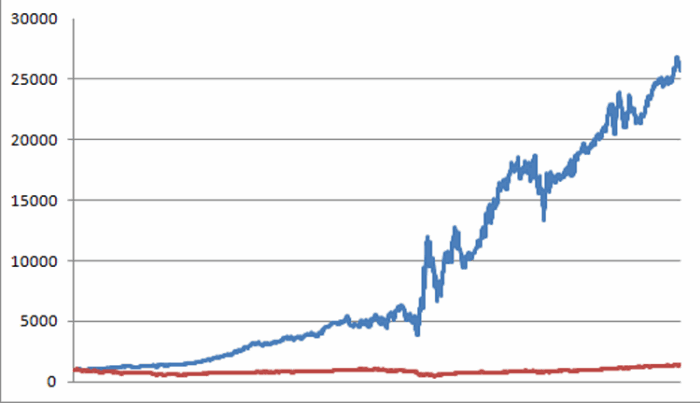
So to get a better feel for things, let’s compare the performance in Figure 2 to that of the S&P 500. In Figure 2 the blue line represent the growth of $1,000 invested in REPIX as described above while the red line represents the growth of $1,000 invested in ticker SPY on a buy-and-hold basis over the same time period.
 Figure 3 – Growth of $1,000 invested in REPIX only on “Best Days” (blue line) versus SPY (red line) (Aug 2000-present)
For the record, $1,000 invested in REPIX during seasonally favorable days grew to $25,694 (+2,469%) while $1,000 invested in ticker SPY on a buy-and-hold basis grew to $1,390 (+39%).
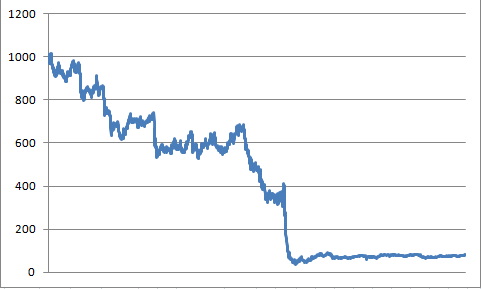
One last comparison to make is to compare the performance of REPI on “seasonally favorable” days versus “all other trading days.” Figure 4 displays the growth of $1,000 invested in REPIX only during the trading days not listed above.
Figure 4 – Growth of $1,000 invested in REPIX only on “non favorable” days (Aug 2000-present)
$1,000 invested in REPIX only on all non-favorable seasonal days actually declined in value to just $82 (-92%).
So let’s sum up the results from August 2000:
SPY: +39%
REPIX non-seasonally favorable days: -92%
REPIX seasonally favorable days: +2,469%
For the record, the difference in the relative rates of return listed above are what we “quantitative analyst types” refer to as “statistically significant.”
Summary
So is everyone going to now resolve to trade real estate stocks on certain days of each and every single month going forward? Surely not. This strategy has serious risk and volatility involved. So this is not a “hey let’s bet the ranch” type of idea. Still, a roughly 30% a year average annual return typically does involve some risk.
So most people will shy away from anything even remotely resembling what I have just described. But if you carefully reread the section above titled “The Gist of Seasonal Trends” then you may come to understand that that is exactly my point.
Jay Kaeppel


I’m a big fan of seasonality (yes, I have read your book), and I’m ok with the beginning and end of month days but what about 8, 12 & 15? Any idea why these dates might be significant?
Ryan
https://daxgaptrading.wordpress.com/
Ryan, you hit the $64,000 question on the head regarding any seasonal tendency. The reality (in my mind anyway) is that there is no specific reason that one can point to regarding TDM 8,12,15. Which is why I mentioned in the article that a person can make the argument that much of “seasonality” is curve-fitting. For the record, the testing that I have done involves looking at a given seasonal period across various time periods and seeing how consistently the trading vehicle in question performs well (or poorly). But the question that remains for each trader to answer is “how confident am I that this trend will persist in the future.” I’ve seen enough to develop a degree of confidence, but everyone must reach their own conclusions. Thanks for the comment, Jay
It is interesting how $1000 invested in SPY on same “Best Days” look like.
Valery, Yes absolutely regarding end of month and start of month. However, if I take SPY daily return x 1.5 and trade that (long) only during the dates listed in the article (last 2, first 4, #s 8, 12 and 15), $1,000 grows to $4,692. Not bad but nowhere close to the return for REPIX. Jay
This comment says “last 2, first 4, #s 8, 12 and 15), ”
But, the text says… ‘The last 4 and the first 2’
Which is the typo?
BTW, love your posts.
Oops. Last 4 and first 2 is the correct version. Jay
Jay, I have done a lot of work with a large data set on the S&P500. Most of my work has been on using the calendar day of the year. So my studies include weekends. For example I look at September 15th over 60+ years, and include the 0.00% returns on Saturdays and Sundays. Have you looked at calendar days versus trade days, and if so do you find any significant differences?
I have not done alot of work with calendar days. Could be fertile ground for research. Jay
The explosive performance of REPIX from August 2000-present reflected in Figure 3 utilizing your seasonality strategy seems to commence about the same time as the market taking off from the Great Recession. While Figure 3 shows a roughly 5-fold increase as compared to the Dow Jones’ roughly 3 fold increase from the start of the takeoff to the present, REPIX is a real estate sector fund while the Dow Jones is large caps of all stripes, and real estate was recovering from its own collapse during the period of the explosive performance reflected in figure 3.. To get a better sense of whether what is shown in figure 3 is a fluke or not, can you show how your theory works in different time periods during which the performance of REPIX, or the fund for other sectors you believe your theory apples to, varies.
Jay, Have been following and using your JSSC system on UDOW with great results the past 2 years. Just bought your book for Christmas and it looks to be something I will enjoy and use right away.
Thanks for these posts. What’s your data source for mutual fund historical prices? Thanks.