Yes, it really is “the most wonderful time of the year” – at least in the stock market. But not always. But usually. In my book “Seasonal Stock Market Trends” (which may well be the gift that the trading loved one in your life secretly desires but is too shy to ask for, hint, hint) I wrote about “Holidays.” Starting with works from Hirsch, Fosback, Zweig, Eliades and whoever else I could think of to steal, er, borrow from, I looked at the performance for the stock market on each of the three days before and after a market holiday.
While I personally found the results to be interesting, it strikes me as curve-fitting to say something like “you should be long the stock market the second trading day before Christmas, the day after Thanksgiving , the second trading day after the 4th if July”, etc. Instead I prefer to look at “holiday trading season” as the three trading days before and the three trading days after a market holiday, in totality. So this week let’s look at the three trading days before Christmas through the three trading days after New Year’s period.
The Year-End Seasonal Pattern
To define things, we are looking specifically at the period that:
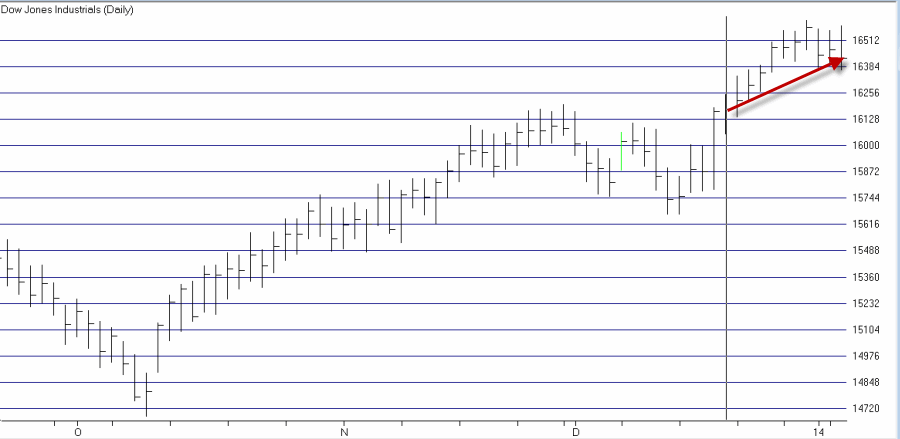
*Starts at the close of trading four trading days before Christmas (in this case, Friday, Dec. 19th, 2014)
*Ends at the close of trading on the third trading day of January (i.e., the third trading day after New Years, in this case, Tuesday, Jan. 6, 2015)
This period during the 2013-2014 year-end period is highlighted in Figure 1. Figure 1 – Bullish Year-End Period 2013-2014 (Courtesy: AIQ TradingExpert)
The Results
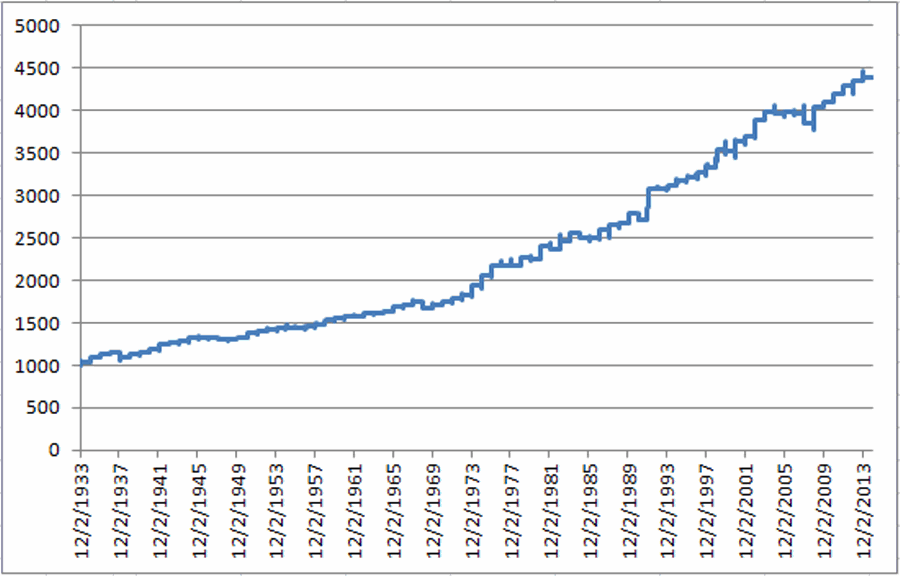
To get a true sense of the bullish bias during this period, Figure 2 displays the growth of $1,000 invested in the Dow Industrials ONLY during this “bullish year-end” period starting in December 1933. Figure 2- Growth of $1,000 invest in Dow only during bullish year-end period
The annual results using the Dow Jones Industrial Average appear in Figure 2.
| Period End Date | DJIA %+(-) |
| 01/04/34 | 3.67 |
| 01/04/35 | 5.12 |
| 01/04/36 | 3.28 |
| 01/05/37 | 1.83 |
| 01/05/38 | (4.09) |
| 01/05/39 | 2.41 |
| 01/04/40 | 2.21 |
| 01/04/41 | 2.74 |
| 01/05/42 | 5.95 |
| 01/05/43 | 0.88 |
| 01/05/44 | 2.05 |
| 01/04/45 | 2.54 |
| 01/04/46 | 0.15 |
| 01/04/47 | (0.52) |
| 01/06/48 | (1.07) |
| 01/05/49 | 0.41 |
| 01/05/50 | 1.70 |
| 01/04/51 | 4.03 |
| 01/04/52 | 1.34 |
| 01/06/53 | 1.98 |
| 01/06/54 | 0.34 |
| 01/05/55 | (0.02) |
| 01/05/56 | 0.45 |
| 01/04/57 | 0.63 |
| 01/06/58 | 2.62 |
| 01/06/59 | 3.18 |
| 01/06/60 | 0.99 |
| 01/05/61 | 1.28 |
| 01/04/62 | 0.02 |
| 01/04/63 | 2.35 |
| 01/06/64 | 0.74 |
| 01/06/65 | 1.14 |
| 01/05/66 | 3.09 |
| 01/05/67 | 1.37 |
| 01/04/68 | 2.05 |
| 01/06/69 | (3.95) |
| 01/06/70 | 1.75 |
| 01/06/71 | 2.00 |
| 01/05/72 | 2.19 |
| 01/04/73 | 3.04 |
| 01/04/74 | 6.11 |
| 01/06/75 | 5.42 |
| 01/06/76 | 5.50 |
| 01/05/77 | 0.58 |
| 01/05/78 | (0.16) |
| 01/04/79 | 4.59 |
| 01/04/80 | (1.20) |
| 01/06/81 | 7.20 |
| 01/06/82 | (1.38) |
| 01/05/83 | 4.02 |
| 01/05/84 | 3.24 |
| 01/04/85 | (1.91) |
| 01/06/86 | 0.24 |
| 01/06/87 | 3.24 |
| 01/06/88 | 2.38 |
| 01/05/89 | 1.13 |
| 01/04/90 | 3.73 |
| 01/04/91 | (2.31) |
| 01/06/92 | 13.41 |
| 01/06/93 | (0.22) |
| 01/05/94 | 1.16 |
| 01/05/95 | 2.22 |
| 01/04/96 | 1.25 |
| 01/06/97 | 1.44 |
| 01/06/98 | 1.93 |
| 01/06/99 | 6.19 |
| 01/05/00 | (0.19) |
| 01/04/01 | 3.10 |
| 01/04/02 | 1.88 |
| 01/06/03 | 4.89 |
| 01/06/04 | 2.53 |
| 01/05/05 | (0.60) |
| 01/05/06 | 0.71 |
| 01/05/07 | (0.59) |
| 01/04/08 | (3.08) |
| 01/06/09 | 5.08 |
| 01/06/10 | 1.53 |
| 01/05/11 | 2.13 |
| 01/05/12 | 2.58 |
| 01/04/13 | 1.38 |
| 01/06/14 | 0.87 |
| Average | 1.88 |
| Median | 1.83 |
| Maximum % | 13.41 |
| Minimum % | (4.09) |
| # Times Up | 66.00 |
| # Times Down | 15.00 |
| % Times Up | 81.48 |
| % Times Down | 18.52 |
Figure 2 – Year-by-Year Results; Year-End Rally
As you can see in Figure 2, there is some good news and some bad news, but mostly good news. To wit:
*This period has showed a gain 81.5% of the time.
*This period is in no way “guaranteed” to result in a profit as it has showed a loss 18.5% of the time
*The largest up period was +13.41% (1991-1992)
* The largest down period was -4.09% (1937-1938)
*The “average winning trade” and “median winning trade” was +2.62% and +2.16%, respectively.
*The “average losing trade” and “median losing trade” was (-1.42%) and (-1.07%), respectively.
Summary
So is the stock market “sure to rally” between now and 1/6/15? Of course not. Nevertheless, the results displayed above suggest that traders are typically wise to give the bullish case the benefit of the doubt during the Christmas/New Year’s Holiday Seasonal.
Wishing all JayOnTheMarkets.com readers a “Very Merry Christmas and a Happy New Year” (unless of course, you are offended by this, in which case, wishing you “Whatever”.)
Jay Kaeppel


This is clearly the best time of the year for a leveraged index trade…
http://nightlypatterns.wordpress.com
Jay, any chance you’ll update your book and release a revised version?…. Keith