I am pretty sure I write this same article every year – but who can blame me? Soybeans are about to enter one of their most “unfavorable” seasonal periods of the year.
The Seasonal Pattern
Soybeans tend to exhibit weakness between the close of the 14th trading day of June through the close on the 18th trading day of July. This year those dates are:
*The close on June 18th through
*The close on July 27th
The History of our Seasonally Unfavorable Period
Figure 1 displays the hypothetical $ +(-) achieved by holding a long 1-lot position in soybean futures from June Trading Day 14 through July Trading Day 18 every year since 1984.

Figure 1 – $ +(-) holding long 1 soybean futures contract June TDM 14 through July TDM 18
Not a pretty picture.
In sum, this period on a year-to-year basis:
*# of times UP = 10 (28% of the time)
*# of times DOWN = 26 (72% of the time)
*Average gain = +$2,418
*Average loss = (-$5,213)
Figure 2 displays year-by-year results.

Figure 2 – Soybeans year-by-year during “unfavorable” June/July period
Things to Note
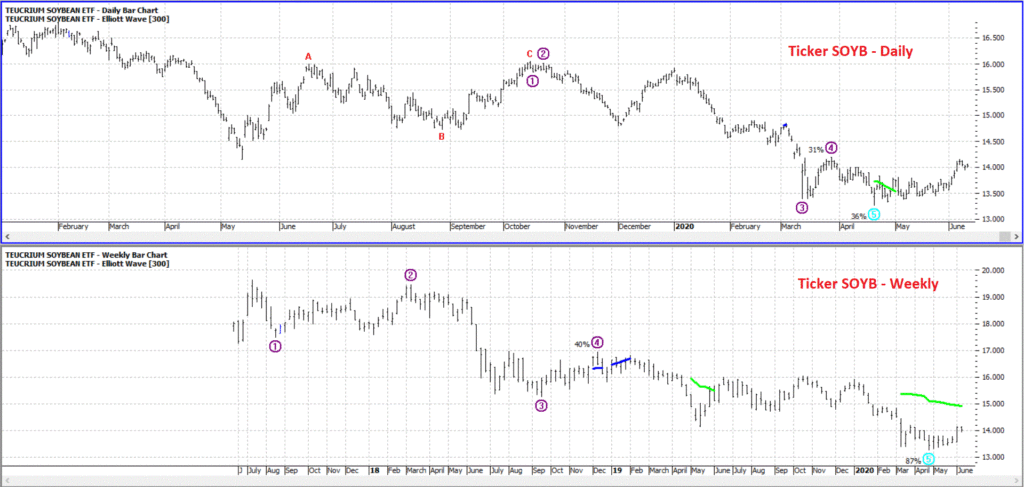
OK, so just because I have written all of this down does that mean that beans are “guaranteed” to decline between the dates listed above? Of course not. For the “counter argument” see Figure 3. The top clip shows the daily chart for ticker SOYB (an ETF that tracks soybean futures) and the bottom clip shows the weekly chart for SOYB.

Figure 3 – Daily and Weekly charts for ticker SOYB with Elliott Wave Counts (Courtesy ProfitSource by HUBB)
Note that BOTH daily and weekly charts have recently completed a 5-wave Elliott Wave decline (according to the algorithm built into ProfitSource software – which I use to generate Elliott Wave counts as I have never been too good at doing it subjectively myself), which suggests that “the bottom may well be in” for soybeans.
So – in theory anyway – we have a bullish technical indication (a potentially favorable Elliott Wave count) and a bearish seasonal indication (a historically unfavorable time of year – more on this in a moment). So, what is a trader to do?
28% of the time beans advanced in price during our supposedly “unfavorable” period. In 2012 the futures contract rose in value by over $6,600. So, the correct response to the information above is NOT to definitively conclude that soybeans WILL fall between June 20th and July 26th this year.
Here is the real point: trading is a game of odds. Therefore, one of the keys to long-term success is putting the odds as much in your favor as possible as often as possible.
When the odds are um, “murky”, sometimes it is best just to stand aside.
The proper response is to ask the question “is my best trading idea to buck the odds and play the long side of beans in the month ahead?”
Remember, trading is a game of odds.
See also Jay’s “A Strategy You Probably Haven’t Considered” Video
See also Video – The Long-Term…Now More Important Than Ever
Jay Kaeppel
Disclaimer: The information, opinions and ideas expressed herein are for informational and educational purposes only and are based on research conducted and presented solely by the author. The information presented represents the views of the author only and does not constitute a complete description of any investment service. In addition, nothing presented herein should be construed as investment advice, as an advertisement or offering of investment advisory services, or as an offer to sell or a solicitation to buy any security. The data presented herein were obtained from various third-party sources. While the data is believed to be reliable, no representation is made as to, and no responsibility, warranty or liability is accepted for the accuracy or completeness of such information. International investments are subject to additional risks such as currency fluctuations, political instability and the potential for illiquid markets. Past performance is no guarantee of future results. There is risk of loss in all trading. Back tested performance does not represent actual performance and should not be interpreted as an indication of such performance. Also, back tested performance results have certain inherent limitations and differs from actual performance because it is achieved with the benefit of hindsight.

