If the market action of the past few months were made into a movie the title would likely be “Revenge of Don’t Fight the Fed.” Amidst all of the gloom, doom and fear – not to mention an actual deadly virus and rioting in the streets – the massive amount of liquidity that the Fed has pumped into the financial system – not to mention that with interest rates nearing 0%, what was the alternative (note to myself: work on those run-on sentences) – has found its way into the stock market in a massively big way.
The good news is that a number of reliable indicators (see here and here) have flashed buy signals that is seems reasonable to believe that fears of a “retest” of the March lows are overblown. Also, a number of “thrust” type indicators reached “launch” mode – which typically, through not always, signals a continuation of a major advance.
The bad news is that speculation and bullishness – particularly among individual option traders (usually a good group to trade contrary to when they become too bullish or bearish as a group) – is back to about where it was in January of this year, before the pandemic induced selloff.
Buying In Now
A lot of investors are clearly “taking the plunge” and buying in, thus propelling the market ever higher. But some are concerned about buying some of the “hotter”, more expensive stocks that are making the largest gains out of fear of a pullback. “There’s a strategy for that situation. There is also a cheaper alternative. The strategy is referred to as the “married put”. Consider AAPL.
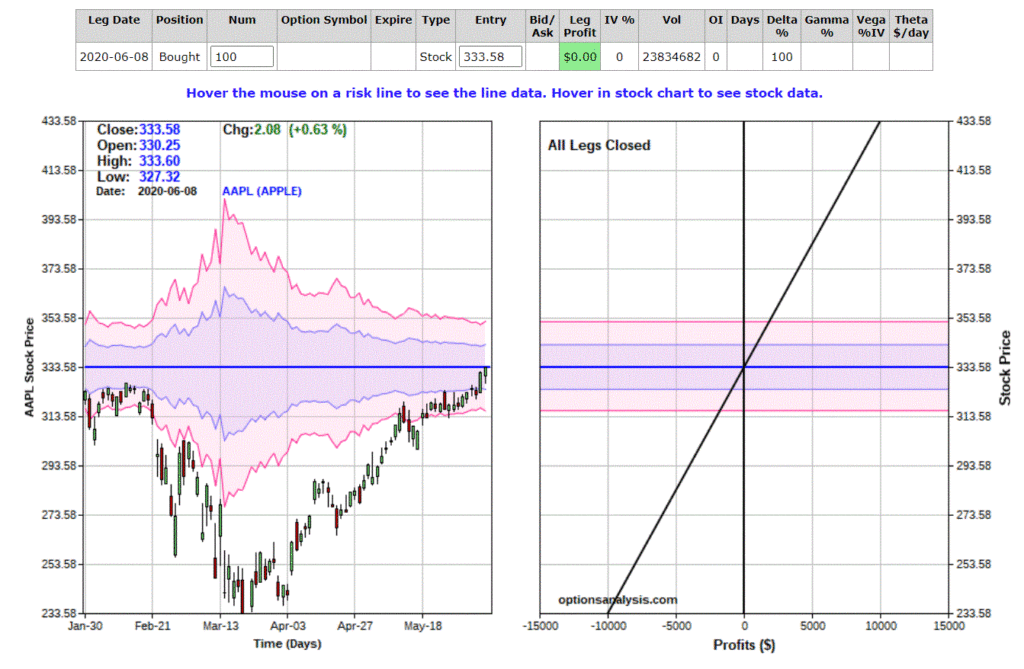
As I write, to buy 100 shares of AAPL costs a cool $33,358. Not a small commitment for the “average” investor. Figure 1 displays the risk “curves” for buying 100 shares of AAPL. For each point AAPL rises the position gains $100 and for each point it declines the position loses $100. Pretty straightforward, and again, a fair amount of dollar risk for the average individual trader.

Figure 1 – Long 100 shares of AAPL (Courtesy www.OptionsAnalysis.com)
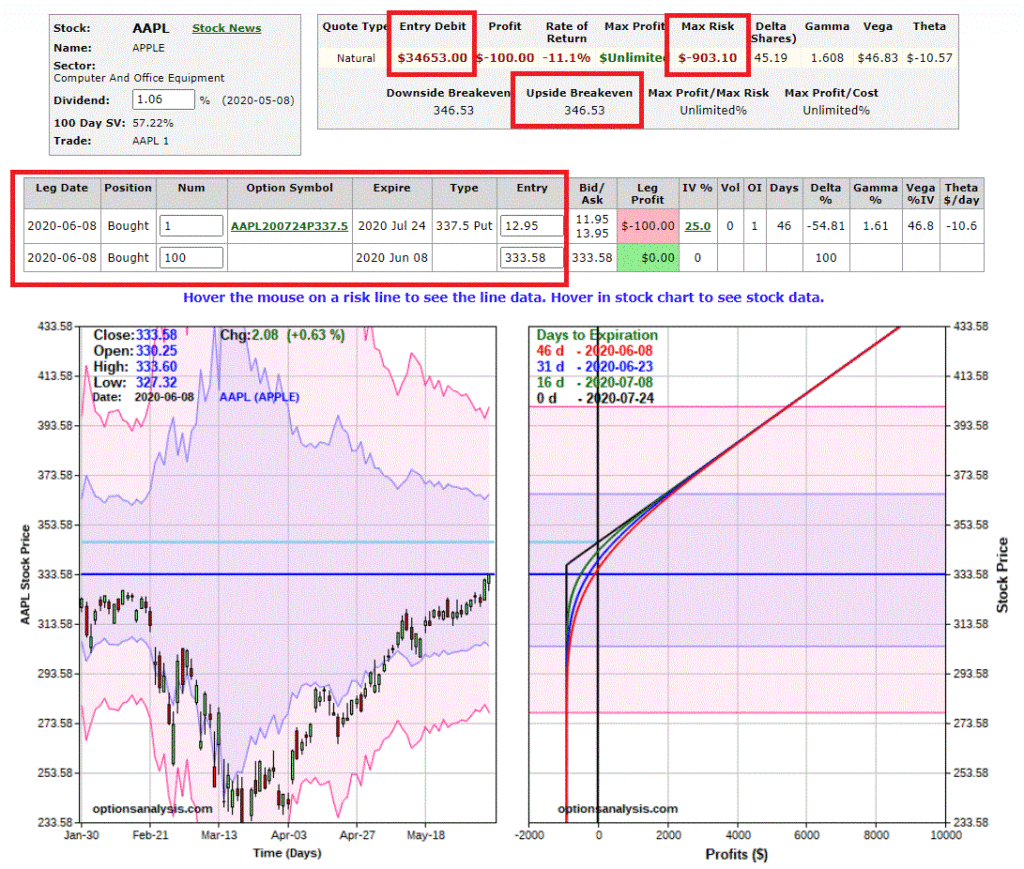
The prospect of losing a lot of money if AAPL somehow reverses (Ha, I know, sounds ridiculous doesn’t it?) is a bit disconcerting for many. So, one alternative is to buy 100 shares of AAPL and also buy a put option. Figure 2 displays the risk curves for buying:
*100 shares of AAPL @ $333.58
*1 Jul24 2020 337.50 put @ $12.95

Figure 2 – Risk curves for AAPL married put (Courtesy www.OptionsAnalysis.com)
*This position costs even more – $34,653 – to enter, because the investor pays an additional $1,295 to buy the put option.
*Also, it is important to note that the breakeven price thus rises from $333.58 a share to $346.53 a share.
*The good news is that between now and option expiration on July 24, the maximum dollar risk on the trade is just -$903.
This “peace of mind” can give an investor the fortitude to go ahead and establish that position in AAPL shares without all of the “angst” of large dollar loss. Just remember that the downside protection last only through option expiration.
An Alternative
One problem with the above is that $34,653 is still a lot of money for the average investor to pony up for one position. An alternative is the “synthetic married put” (DO NOT STOP READING! just because the phrase “synthetic married put” sounds weird and takes you out of your comfort zone).
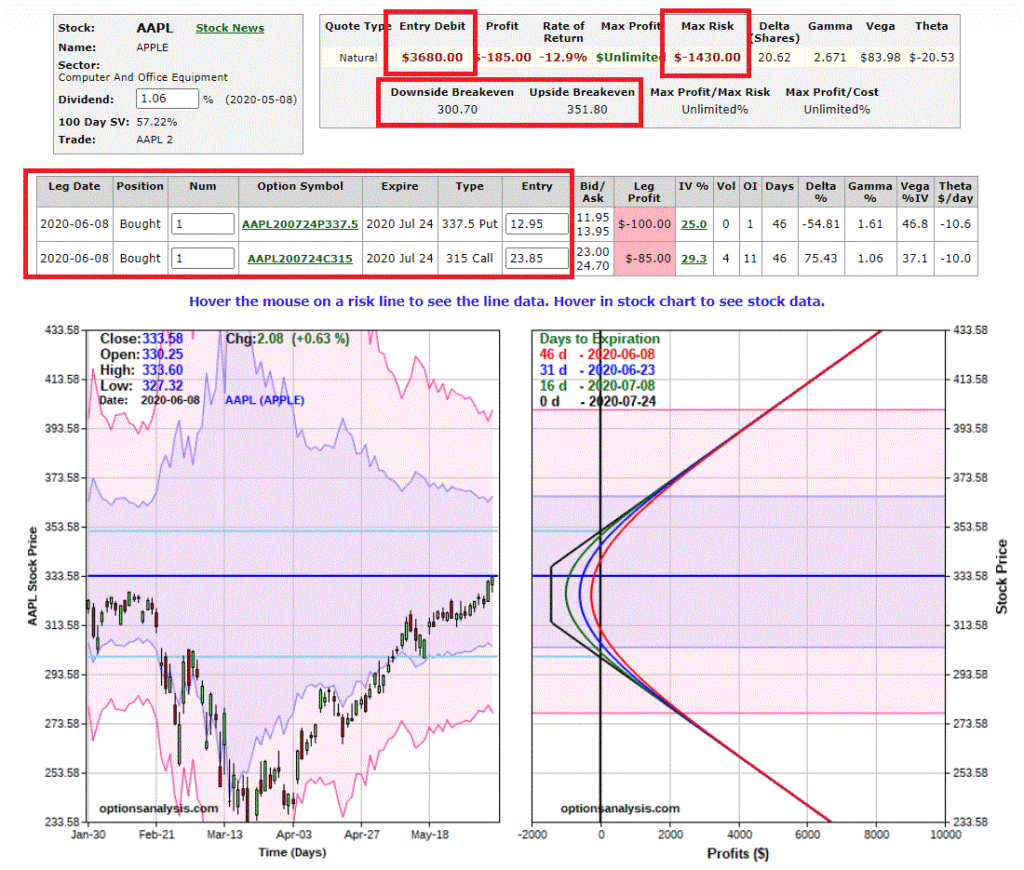
To establish this position, instead of buying 100 shares of stock we will buy a deep-in-the-money call option. One example:
*Buy 1 Jul24 315 call @ $23.85
*Buy 1 Jul24 337.5 put @ $12.95

Figure 3 – Risk curves for AAPL synthetic married put (Courtesy www.OptionsAnalysis.com)
The cost to enter this position is a “mere” $3,680 (i.e., the combined cost of the two options). The bad news is:
*The actual dollar risk for this position (-$1,430) is actually greater than the actual dollar risk for the previous position (-$903).
*The breakeven price on the upside is now $351.80.
The good news is:
*This position costs roughly 89% less to enter ($3,680 for the synthetic position versus $34,653 for the “real thing”).
*The synthetic position has unlimited profit potential to the upside AND to the downside.
While we have already “established the fact” that because of the Fed there “is NO WAY” stocks – especially “really cool” stocks like Apple – can possibly decline in price, the fact remains that if AAPL were to sell off (HA!! Like that would ever happen. But at least in theory it could) the synthetic married put can make alot of money.
At option expiration, if the investor wants to – and can afford to – he or she can exercise the long call option and buy 100 shares of AAPL at $315 a share.
Comparison
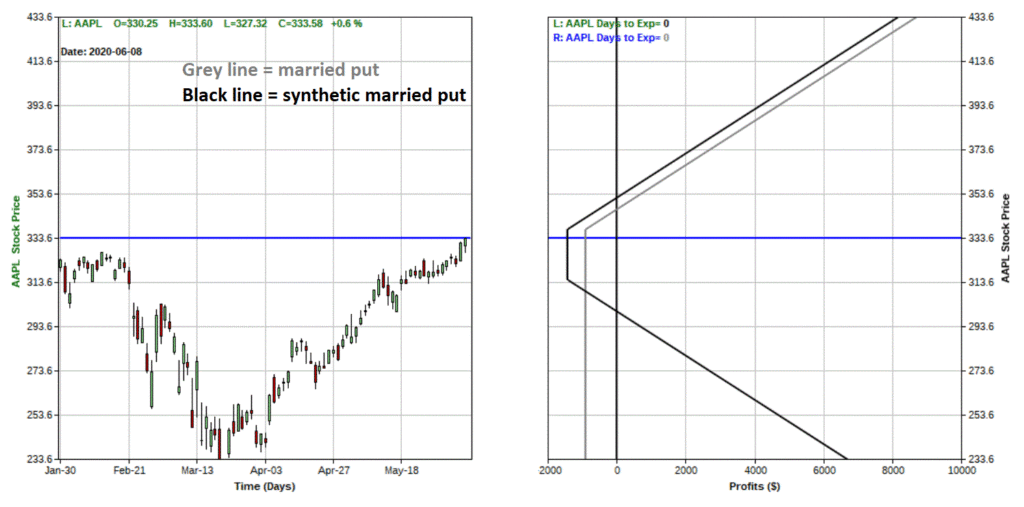
Figure 4 shows the risk curves for both the married put AND synthetic married put positions.

Figure 4 – Married Put risk curve (grey) vs. Synthetic Married Put (black) (Courtesy www.OptionsAnalysis.com)
Note again that the synthetic position:
*Costs 89% less to enter
*Enjoys unlimited profit potential in both directions
*BUT entails a higher actual dollar risk
As always, there is no “best choice”, there are only “tradeoffs.”
See also Jay’s “A Strategy You Probably Haven’t Considered” Video
See also Video – The Long-Term…Now More Important Than Ever
Jay Kaeppel
Disclaimer: The information, opinions and ideas expressed herein are for informational and educational purposes only and are based on research conducted and presented solely by the author. The information presented represents the views of the author only and does not constitute a complete description of any investment service. In addition, nothing presented herein should be construed as investment advice, as an advertisement or offering of investment advisory services, or as an offer to sell or a solicitation to buy any security. The data presented herein were obtained from various third-party sources. While the data is believed to be reliable, no representation is made as to, and no responsibility, warranty or liability is accepted for the accuracy or completeness of such information. International investments are subject to additional risks such as currency fluctuations, political instability and the potential for illiquid markets. Past performance is no guarantee of future results. There is risk of loss in all trading. Back tested performance does not represent actual performance and should not be interpreted as an indication of such performance. Also, back tested performance results have certain inherent limitations and differs from actual performance because it is achieved with the benefit of hindsight.

