Don’t you hate it when some analyst analyzes historical data and then purports to find some “order” in the historical chaos? Hi, my name is Jay. And…it’s just kind of what I do. Sorry, it’s just my nature. Take for instance the ridiculous case of AMD.
Advanced Micro Devices – Ticker AMD
According to “Adjusted Close” price data from www.finance.yahoo.com ticker AMD advanced from $3.15 a share in March of 1980 to $56.39 by May 20, 2020. Given that the stock has risen +1,693% on a buy-and-hold basis, it is not exactly a revelation that – particularly with the huge benefit of perfect hindsight – there was some money to be made by holding the stock.
But that is only part of the story. For as it turns out, AMD is one of the most consistently “cyclical” stocks you may ever find. Figure 1 displays the average annual price trend for AMD from 3/17/1980 through 12/31/1999. In other words, period 1 along the bottom of the chart is January Trading Day #1, and so on, through the last trading day of December.
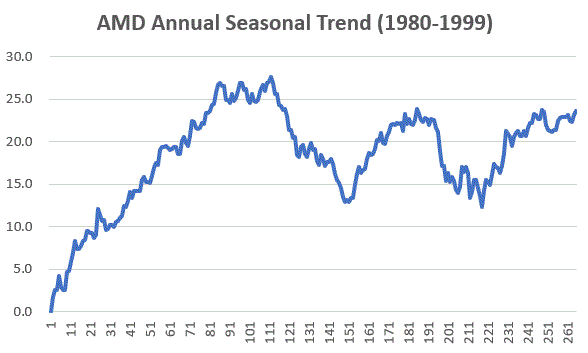
Figure 1 – Annual Seasonal Price Trend for AMD (1980-1999)
As you can see, the stock tended to rally sharply through the end of May, from mid-July through about late August, and from late October through the end of the year (or more accurately, through the end of the next May).
Declines typically occurred between about June 1st and late July and again during September into late October.
Ah, sweet hindsight.
But what are the odds that any of this was meaningful after 1999? I’m glad you asked. Because that’s where the ridiculous part comes in.
2000-2020
Figure 2 plots the same 1980-1999 annual seasonal price trend for AMD along with the annual seasonal trend for AMD from 2000-2019. Notice any similarities?
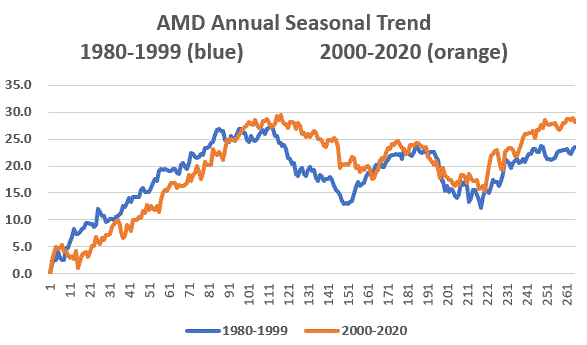
Figure 2 – Annual Seasonal Price Trend for AMD; 1980-1999 and 2000-2020
So, let’s make the ridiculous (there’s that word again) assumption that some (lucky) investor had started trading in and out of AMD on an annual basis the following seasonal calendar

Figure 3 – Annual Seasonal Bullish and Bearish Periods
Some how did the “walk forward” period of 2000 into late May-2020 compare to the “hindsight” period of 1980-1999? Well there is good news and bad news.
The bad news is that results for each period was not quite as good during 2000-2020 as they were during 1980-1999. The good news is that the 2000-2020 results were still pretty darn compelling.

Figure 4 – AMD performance during Bullish and Bearish Periods
The bottom line: The “bullish” periods have to continued to be quite bullish and the “bearish” periods continue to be quite bearish.
For the record, between March 1980 and May 2020:
*$1,000 in AMD on a buy-and-hold basis grew to $17,925
*$1,000 in AMD ONLY during the two “bullish” period discussed grew to $587,558,351
Let’s face it, these are – here I go again – ridiculous numbers. And it should be pointed out that an investor holding AMD only during the “Bullish” periods would have suffered 4 separate drawdowns in excess of -50%, including a -79%(!) drawdown in 2008-2009. See Figure 5. So, don’t anybody get “stars in their eyes.”
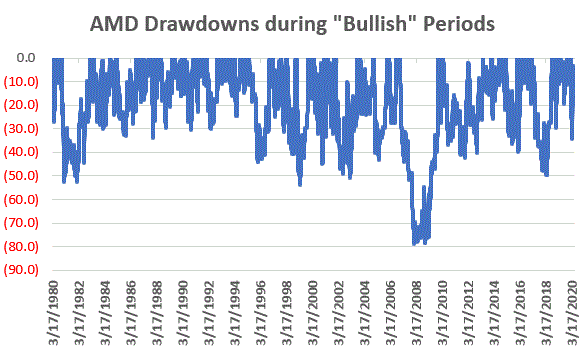
Figure 5 – Drawdowns during Bullish Periods
At the same time, it is still better than the drawdown racked up during the “bearish” periods, which checks in at a cool -99.9867%. See Figure 6.
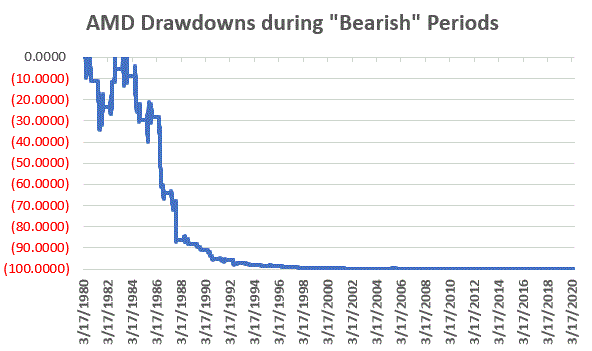
Figure 6 – Drawdowns during Bearish Periods
Where We Are
AMD has been in a “bullish” period since the 19th trading day of October 2019, and this period will last until the close on 5/29/2020. Through 5/20/2020 AMD is up +73% during the current bullish period (i.e., pandemic, schmandemic). See Figure 7.
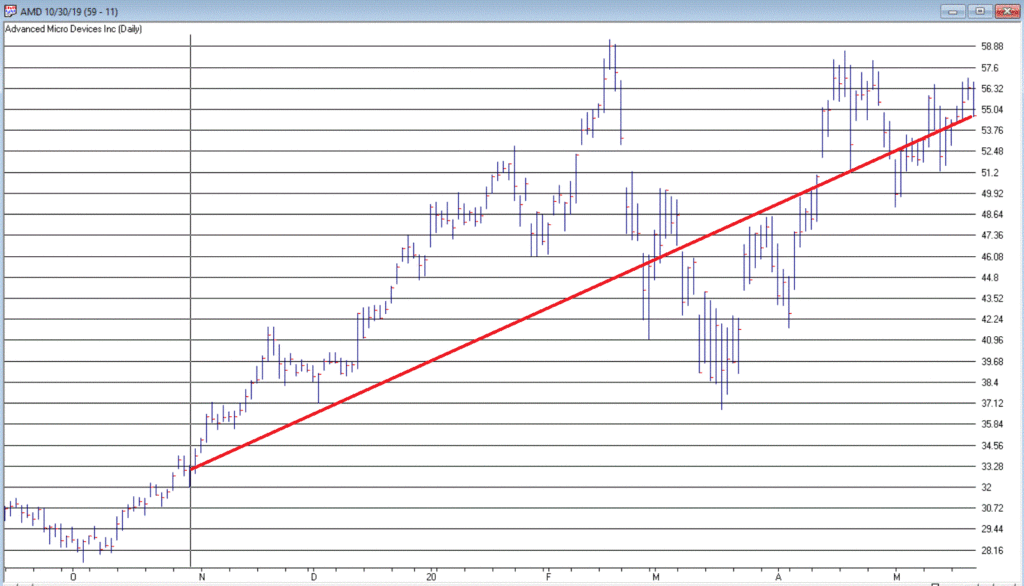
Figure 7 – AMD during recent “Bullish” period (Courtesy AIQ TradingExpert)
The next “bearish” period will last from the close on 5/29/2020 through the close on 7/23/2020.
Summary
So, in hindsight, the annual seasonal pattern for AMD tracked very closely with the annual seasonal pattern for the previous 20 years. But what about the next 20 years? Ah, there’s the rub. Despite the fact that the annual seasonal trend for the past 20 years very closely mirrored the annual seasonal trend for the prior 20 years, it is not possible to state with any certainty what the next 20 years hold.
Still, if I decide to trade AMD I will probably consult my calendar first.
See also Jay’s “A Strategy You Probably Haven’t Considered” Video
Jay Kaeppel
Disclaimer: The information, opinions and ideas expressed herein are for informational and educational purposes only and are based on research conducted and presented solely by the author. The information presented represents the views of the author only and does not constitute a complete description of any investment service. In addition, nothing presented herein should be construed as investment advice, as an advertisement or offering of investment advisory services, or as an offer to sell or a solicitation to buy any security. The data presented herein were obtained from various third-party sources. While the data is believed to be reliable, no representation is made as to, and no responsibility, warranty or liability is accepted for the accuracy or completeness of such information. International investments are subject to additional risks such as currency fluctuations, political instability and the potential for illiquid markets. Past performance is no guarantee of future results. There is risk of loss in all trading. Back tested performance does not represent actual performance and should not be interpreted as an indication of such performance. Also, back tested performance results have certain inherent limitations and differs from actual performance because it is achieved with the benefit of hindsight.

