Well that sounds like a pretty alarming headline, doesn’t it? But before you actually take a moment to locate the nearest exit please note the important difference between the words “Please locate the nearest exit” and “Oh My God, it’s the top, sell everything!!!”
You see the difference, right? Good. Let’s continue. First, a true confession – I am not all that great at “market timing”, i.e., consistently buying at the bottom and/or selling at the top (I console myself with the knowledge that neither is anyone else). On the other hand, I am reasonably good at identifying trends and at recognizing risk. Fortunately, as it turns out, this can be a pretty useful skill.
So, while I may not be good at market timing, I can still make certain reasonable predictions. Like for example, “at some point this bull market will run out of steam and now is as good a time as any to start making plans about how one will deal with this inevitable eventuality – whenever it may come”. (Again, please notice the crucial difference between that sentence and “Oh My God, it’s the top, sell everything!!”)
First the Good News
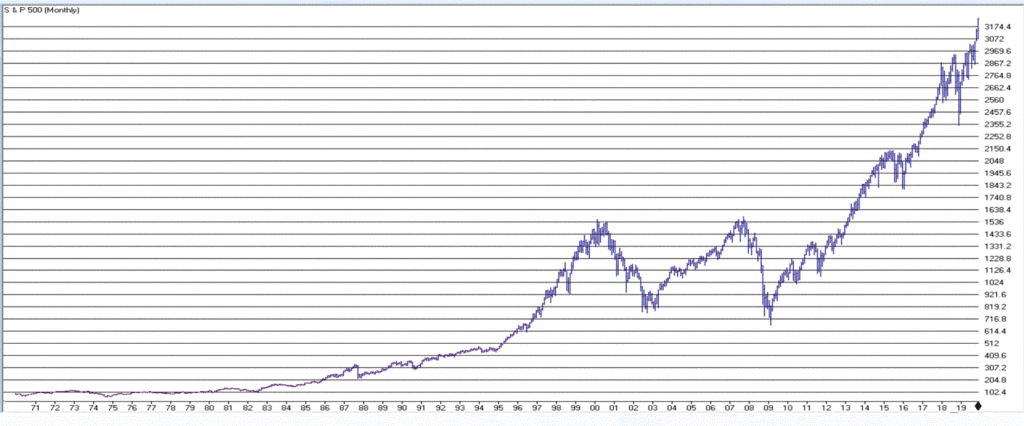
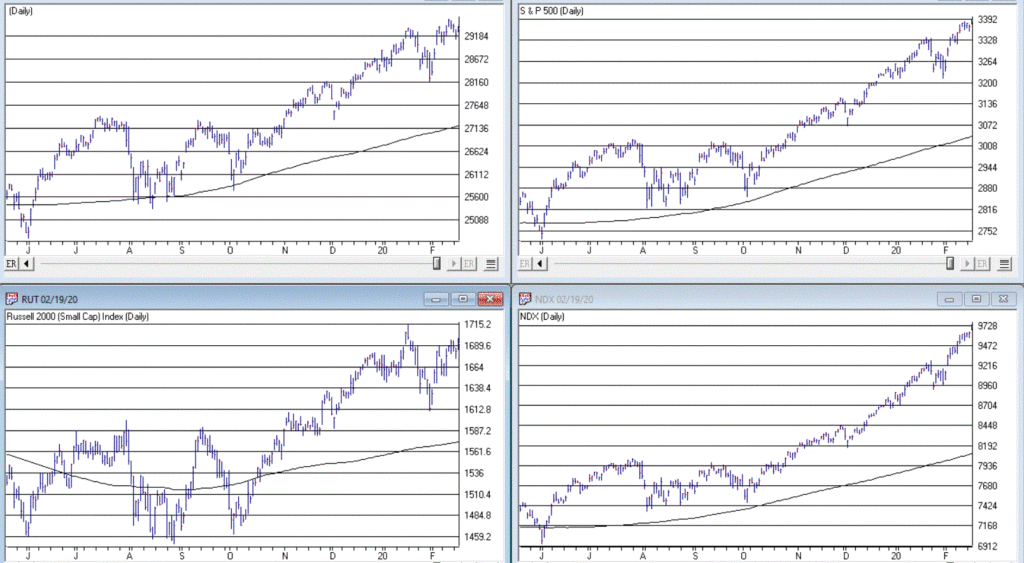
The trend in the stock market is bullish. Duh. Is anyone surprised by that statement? Again, we are talking subtleties here. We are not talking about predictions, forecasts, projected scenarios, implications of current action for the future, etc. We are just talking about pure trend-following and looking at the market as it is today. Figure 1 displays the S&P 500 Index monthly since 1971 and Figure 2 displays four major indexes (Dow, S&P 500, Nasdaq 100, Russell 2000) versus their respective 200-day moving averages.

Figure 1 – S&P 500 Monthly (Courtesy AIQ TradingExpert)

Figure 2 – Dow, S&P 500, Nasdaq 100, Russell 2000 w respective 200-day moving average (Courtesy AIQ TradingExpert)
It is impossible to look at the current status of “things” displayed in Figures 1 and 2 and state “we are in a bear market”. The trend – at the moment – is “Up”. The truth is that in the long run many investors would benefit from ignoring all of the day to day “predictions, forecasts, projected scenarios, implications of current action for the future, etc.” that emanates from financial news and just sticking to the rudimentary analysis just applied to Figures 1 and 2.
In short, stop worrying and learn to love the trend. Still, no trend lasts forever, which is kind of the point of this article.
So now let’s talk about the “Bad News”. But before we do, I want to point out the following: the time to actually worry and/or do something regarding the Bad News will be when the price action in Figure 2 changes for the worse. Let me spell it out as clearly and as realistically as possible.
If (or should I say when?) the major U.S. stock indexes break below their respective 200-day moving averages (and especially if those moving average start to roll over and trend down):
*It could be a whipsaw that will be followed by another rally (sorry folks, but for the record I did mention that I am not that good at market timing and that I was going to speak as realistically as possible – and a whipsaw is always a realistic possibility when it comes to trend-following)
*It could be the beginning of a significant decline in the stock market (think -30% or possibly even much more)
So, the proper response to reading the impending discussion of the Bad News is not “I should do something”. The proper response is “I need to resolve myself to doing something when the time comes that something truly needs to be done.”
You see the difference, right? Good. Let’s continue.
The Bad News
The first piece of Bad News is that stocks are overvalued. Now that fact hardly scares anybody anymore – which actually is understandable since the stock market has technically been overvalued for some time now AND has not been officially “undervalued” since the early 1980’s. Also, valuation is NOT a timing tool, only a perspective tool. So high valuation levels a re pretty easy to ignore at this point.
Still, here is some “perspective” to consider:
*Recession => Economic equivalent of jumping out the window
*P/E Ratio => What floor you are on at the time you jump
Therefore:
*A high P/E ratio DOES NOT tell you WHEN a bear market will occur
*A high P/E ratio DOES WARN you that when the next bear market does occur it will be one of the painful kind (i.e., don’t say you were not warned)
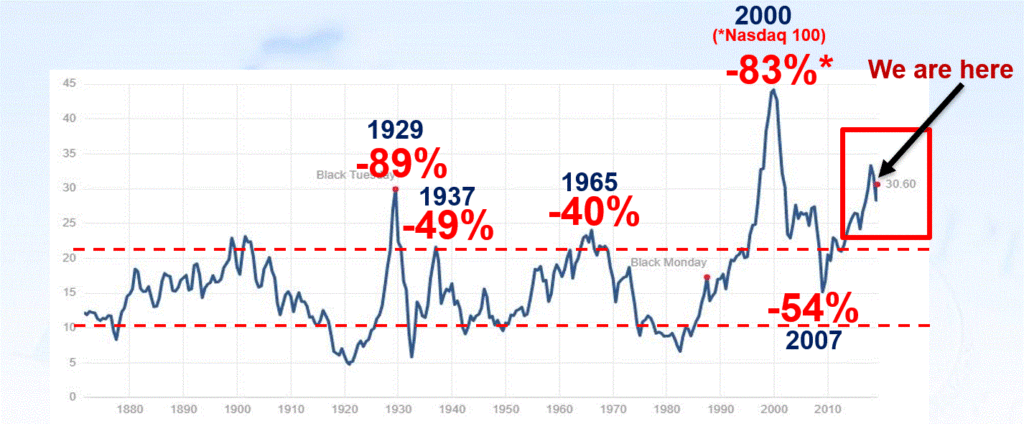
Figure 3 displays the Shiller P/E Ratio plus (in red numbers) the magnitude of the bear market that followed important peaks in the Shiller P/E Ratio.

Figure 3 – Shiller P/E Ratio Peaks (with subsequent bear market declines in red); (Courtesy: https://www.multpl.com/shiller-pe)
Repeating now: Figure 3 does not tell us that a bear market is imminent. It does however, strongly suggest that whenever the next bear market does unfold, it will be, ahem, significant in nature. To drive this point home, a brief history:
1929: P/E peak followed by -89% Dow decline in 3 years
1937: P/E peak followed by -49% Dow decline in 7 months(!?)
1965: P/E peak followed by 17 years of sideways price action with a -40% Dow decline along the way
2000: P/E peak followed by -83% Nasdaq 100 decline in 2 years
2007: P/E peak followed by -54% Dow decline in 17 months
Following next peak: ??
As you can see, history suggests that the next bear market – whenever it may come – will quite likely be severe. There is actually another associated problem to consider. Drawdowns are one thing – some investors are resolved to never try to time anything and are thus resigned to the fact that they will have to “ride ‘em out” once in awhile. OK fine – strap yourself in and, um, enjoy the ride. But another problem associated with high valuation levels is the potential (likelihood?) for going an exceedingly long period of time without making any money at all. Most investors have pretty much forgotten – or have never experienced – what this is like.
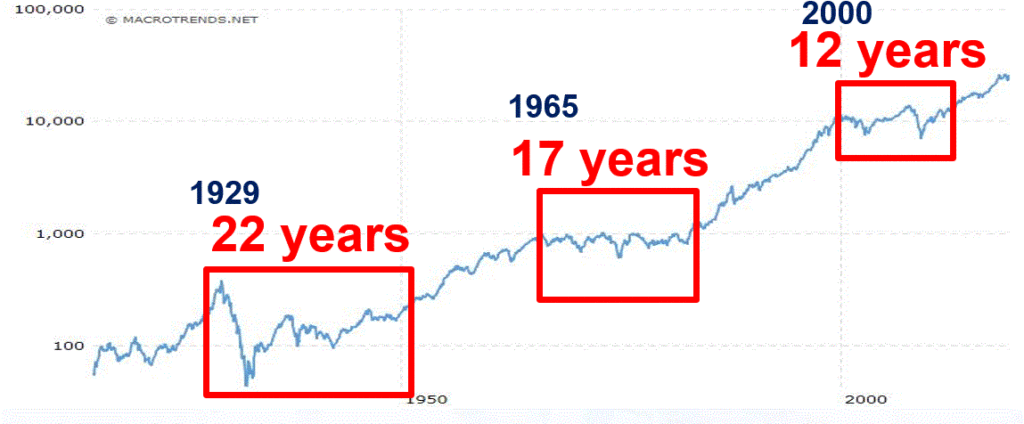
Figure 4 displays three such historical periods – the first associated with the 1929 peak, the second with the 1965 peak and the third with the 2000 peak.

Figure 4 – Long sideways periods often follow high P/E ratios
*From 1927 to 1949: the stock market went sideways for 22 years. Some random guy in 1947 – “Hey Honey, remember that money we put to work in the stock market back in 1927? Great News! We’re back to breakeven! (I can’t speak for anyone else, but personally I would prefer to avoid having THAT conversation.)
*From 1965 to 1982: the stock market went sideways. While this is technically a 0% return over 17 years (with drawdows of -20%, -30% and -40% interspersed along the way – just to make it less boring), it was actually worse than that. Because of high inflation during this period, purchasing power declined a fairly shocking -75%. So that money you “put to work” in that S&P 500 Index fund in 1965, 17 years later had only 25% as much purchasing power (but hey, this couldn’t possibly happen again, right!?).
*From 2000 to 2012: the stock market went sideways. With the market presently at much higher all-time highs most investors have forgotten all about this. Still, it is interesting to note that from 8/31/2000 through 1/31/2020 (19 years and 5 months), the average annual compounded total return for the Vanguard S&P 500 Index fund (ticker VFINX) was just +5.75%. Not exactly a stellar rate of return for almost 20 years of a “ride ’em out” in an S&P 500 Index fund approach).
The Point: When valuations are high, future long-term returns tend to be subpar – and YES, valuations are currently high.
You have been warned.
Stay tuned for Part II…
Jay Kaeppel
Disclaimer: The information, opinions and ideas expressed herein are for informational and educational purposes only and are based on research conducted and presented solely by the author. The information presented does not represent the views of the author only and does not constitute a complete description of any investment service. In addition, nothing presented herein should be construed as investment advice, as an advertisement or offering of investment advisory services, or as an offer to sell or a solicitation to buy any security. The data presented herein were obtained from various third-party sources. While the data is believed to be reliable, no representation is made as to, and no responsibility, warranty or liability is accepted for the accuracy or completeness of such information. International investments are subject to additional risks such as currency fluctuations, political instability and the potential for illiquid markets. Past performance is no guarantee of future results. There is risk of loss in all trading. Back tested performance does not represent actual performance and should not be interpreted as an indication of such performance. Also, back tested performance results have certain inherent limitations and differs from actual performance because it is achieved with the benefit of hindsight.

