Trading options can be just about as simple or complex as one would like it to be. Today, let’s go the “simple” route.
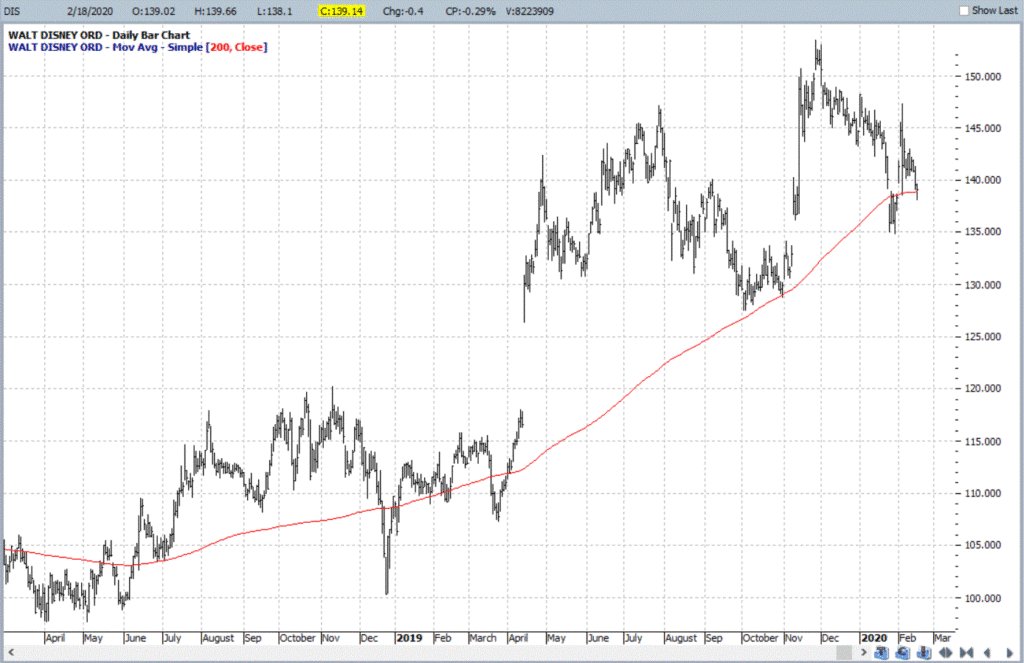
Figure 1 displays a daily bar chart of Disney (DIS). Different viewers will see different things. Some will see a stock that is pulling back and testing support at the 200-day moving average setting up for the next up leg of a bullish trend. Others will see a stock that tried to break out and failed and is now rolling over and above to break below its 200-day moving average into a bearish trend. I can’t tell you who will be right and who will be wrong.

Figure 1 – Disney stock (DIS) (Courtesy ProfitSource by HUBB)
But let’s suppose you fall into the bullish camp. The most direct play would be to buy 100 shares of DIS and hope the stock rises in price back towards its previous high of $153.41 a share. As I write the stock is trading at $139.14 a share, so the trader would need to pony up $13,914. For the average investor this is not a small commitment. If DIS rallied back to its previous high the trader would make a little over 10%. Is this a good idea or a bad idea? That’s not for me to say. I will simply offer up a potential alternative and you can decide for yourself.
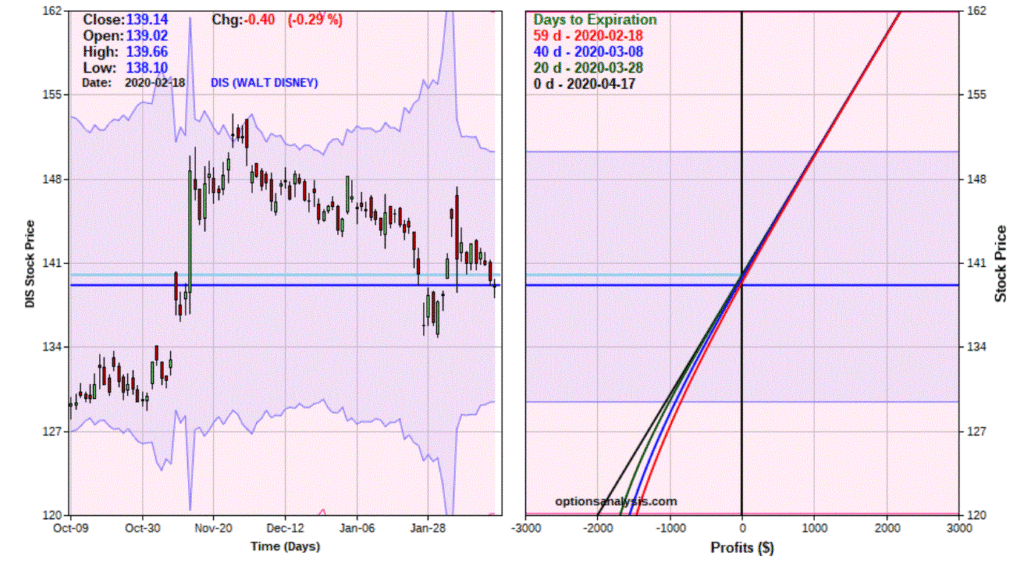
A simple alternative would be to buy one April2020 120 calls for $20.00 each (for the record, the bid is $19.80 and the ask is $20.00. Most serious traders would consider placing a limit order to try to buy somewhere near the middle of the bid/ask spread. For our illustrative purposes, we are just going to assume that a “market” order is placed and that the call is bought at $20.00).
Figure 2 displays the particulars and Figure 3 displays the risk curves.

Figure 2 – Trade details for April 2020 120 DIS call (Courtesy www.OptionsAnalysis.com)

Figure 3 – Risk curves for April 2020 120 DIS call (Courtesy www.OptionsAnalysis.com)
Things to note:
*The cost to enter – and maximum risk – is $2,000.
*The trade has until April (59 calendar days, or roughly two months) to work out
*The breakeven price at expiration is $140.00 (in other words if DIS does not rise, this trade is certain to lose money
*The trade has a “delta” of 91.36, which means it will act much like a position of 91 shares of stock
The Comparison
Now let’s compare the two trades. Figure 4 displays the expected % return on investment as of April 20 based on the share price for DIS.

Figure 4 – % Profit or Loss at Option Expiration at various prices for DIS
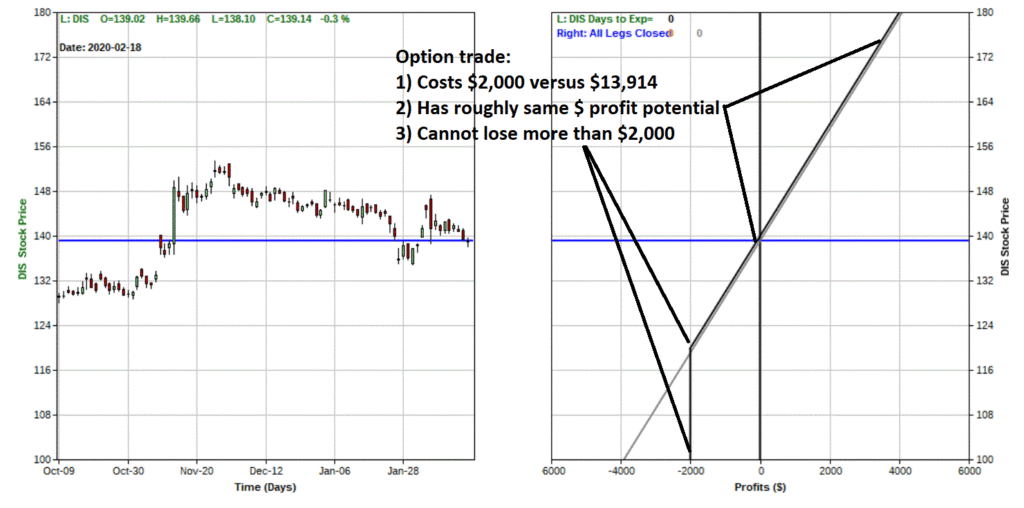
Figure 5 overlays the risk curves for holding 100 shares of DIS stock (cost = $13,914 with a delta of 100) versus holding 2 June 140 calls (cost = $1,340 with a delta of 91)

Figure 5 – Risk curves for April2020 120 call option versus buying 100 shares of DIS stock (Courtesy www.OptionsAnalysis.com)
Things to note:
*Because the option has a high delta, the $ profit/loss for the option trade will track very closely with the stock trade, even though it costs only 14.4% as much ($2,000 versus $13,941) to enter
*Below the strike price of 120, losses are limited for the option trade to the premium paid ($2,000). Losses would continue to grow for the trader holding shares of stock (see grey line in Figure 5).
*This is essentially a “stock replacement” trade – in other words, we use the option as a proxy for buying the stock and commit roughly 86% less capital
Summary
As always, this trade is not a “recommendation”, and I am offering no opinion as to whether DIS will rise or fall in the months ahead. The point of this example is to point out the potential to achieve virtually the same reward/risk profile while committing a great deal less capital by buying an option rather than 100 shares of stock.
Jay Kaeppel
Disclaimer: The information, opinions and ideas expressed herein are for informational and educational purposes only and are based on research conducted and presented solely by the author. The information presented does not represent the views of the author only and does not constitute a complete description of any investment service. In addition, nothing presented herein should be construed as investment advice, as an advertisement or offering of investment advisory services, or as an offer to sell or a solicitation to buy any security. The data presented herein were obtained from various third-party sources. While the data is believed to be reliable, no representation is made as to, and no responsibility, warranty or liability is accepted for the accuracy or completeness of such information. International investments are subject to additional risks such as currency fluctuations, political instability and the potential for illiquid markets. Past performance is no guarantee of future results. There is risk of loss in all trading. Back tested performance does not represent actual performance and should not be interpreted as an indication of such performance. Also, back tested performance results have certain inherent limitations and differs from actual performance because it is achieved with the benefit of hindsight.

