The energy sector is getting a lot of attention these days. And not much of it in a good way. I do think that there is a chance that that will soon change. That being said, that statement is not a “call to action”, but rather it is simply me informing you of an opinion that even I have not acted on yet.
The Case for Energies
First off, I recommend that you see this article written my Thomas Hayes of www.HedgeFundTips.com, which offers some excellent points regarding why a bullish stance on energies is warranted. Two other pieces of the puzzle are sentiment and seasonality.
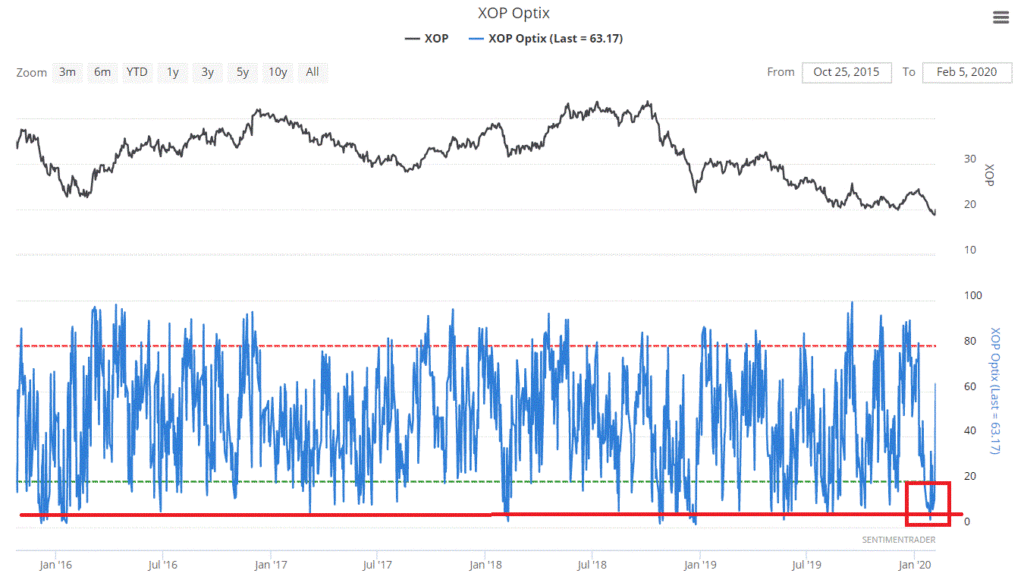
Figure 1 displays the recent sentiment reading for ticker XOP from one of my favorite websites, www.sentimentrader.com.

Figure 1 – Sentiment for ticker XOP (SPDR S&P Oil & Gas Exploration & Production ETF) (Courtesy Sentimentrader.com)
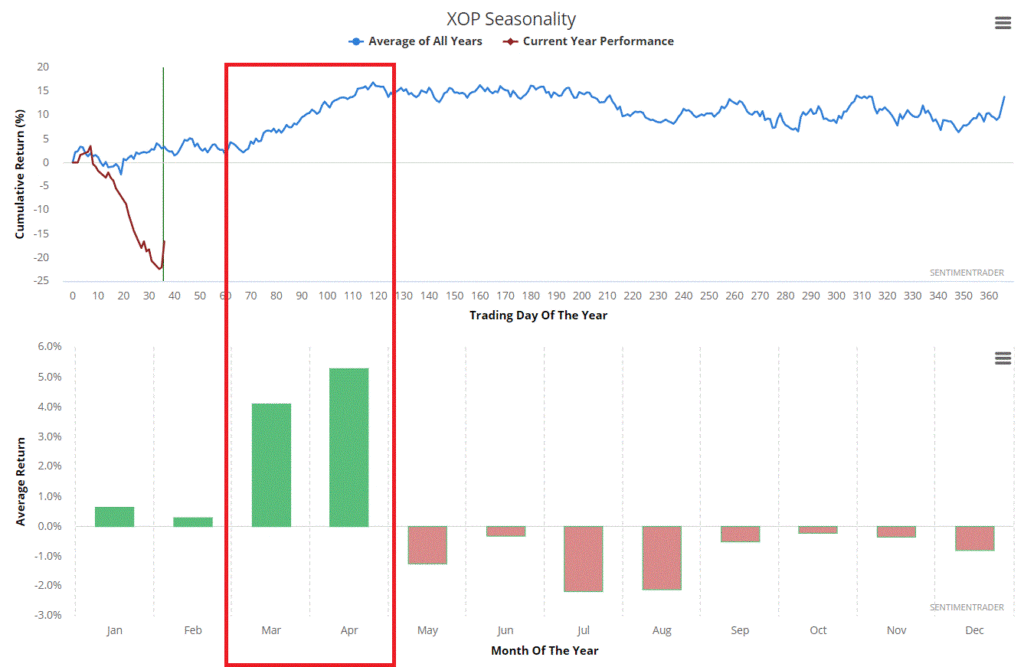
Figure 2 – also from Sentimentrader.com – displays the typical annual seasonal pattern for ticker XOP, which clearly shows that March and April have historically – though importantly, not always – been the best months for energy stocks.

Figure 2 – Annual Seasonal Trend for ticker XOP (Courtesy Sentimentrader.com)
So, what we have is:
*Strong earnings in the energy sector (per the linked article)
*A recent extreme in bearish sentiment (Figure 1), typically a bullish contrarian sign
*A pending favorable seasonal period (Figure 2)
That’s about as favorable of a trifecta as you will find as it relates to an individual market sector. That’s the Good News. The Bad News is that this in no way guarantees that energy stocks are going to rally anytime soon. With the overall “investment world” focused on large cap stocks and tech stocks and so on, “buying the Dogs” is not a high priority for most investors.
But consider the following. Figure 3 displays the cumulative total return achieved by holding Fidelity Select Energy Services (which has a roughly 90% correlation to ticker XOP and started trading in 1986) ONLY during the months of March and April every year since 1986.

Figure 3 – Growth of $1,000 invested in ticker FSESX ONLY during March and April since 1986
A few things to note:
*# of years showing a Mar-Apr gain = 24 (71% of the time)
*# of years showing a Mar-Apr gain = 10 (29% of the time)
*Average UP Mar-Apr gain = +13.9%
*Average DOWN Mar-Apr loss = (-4.7%)
By no means a “sure thing”, but if you had to bet, you would likely bet “bullish”
Will Mar-Apr 2020 witness a gain in the energy sector? And more importantly, is its worth risking money on? That’s up to each investor to decide for themselves.
One more “food for thought” item for those so inclined. Ticker ERX is the Direxion: EnergyBull 3X ETF. For the record I am not a huge fan of 3X leveraged funds (really, really bad things can happen if your timing is off), but for what it’s worth Figure 4 displays the growth of $1,000 invested in ticker ERX only during March and April every year since ERX started trading (Dec 2008).

Figure 4 – Growth of $1,000 invested in ticker ERX ONLY during March and April since 2009
A few things to note:
*# of years showing a Mar-Apr gain = 9 (82% of the time)
*# of years showing a Mar-Apr gain = 2 (18% of the time)
*Average UP Mar-Apr gain = +21.5%
*Average DOWN Mar-Apr loss = (-14.1%)
The cumulative growth from holding ERX for 22 months (2 months times 11 years) was +285.3%. But make no mistake, this is a highly volatile and risky approach. Note that 2012 and 2017 saw ERX lose -14.1% and -14.2% respectively, during March and April – so not for the faint of heart.
Figure 5 displays the year-by-year Mar-Apr total return for FSESX.
Figure 6 displays the year-by-year Mar-Apr total return for ERX.
| Year | FSESX Mar-Apr |
| 1986 | (2.1) |
| 1987 | 9.5 |
| 1988 | 8.0 |
| 1989 | 11.4 |
| 1990 | (0.7) |
| 1991 | (7.3) |
| 1992 | 0.5 |
| 1993 | 13.7 |
| 1994 | (2.7) |
| 1995 | 11.9 |
| 1996 | 16.0 |
| 1997 | 5.7 |
| 1998 | 16.4 |
| 1999 | 63.7 |
| 2000 | 15.7 |
| 2001 | 6.1 |
| 2002 | 17.4 |
| 2003 | (3.0) |
| 2004 | (2.8) |
| 2005 | (8.5) |
| 2006 | 15.7 |
| 2007 | 16.8 |
| 2008 | 13.4 |
| 2009 | 28.0 |
| 2010 | 8.1 |
| 2011 | 1.7 |
| 2012 | (6.2) |
| 2013 | 0.6 |
| 2014 | 6.2 |
| 2015 | 10.6 |
| 2016 | 24.6 |
| 2017 | (10.2) |
| 2018 | 12.7 |
| 2019 | (3.4) |
Figure 5 – FSESX year-by-year March-April total return
| Year | ERX Mar-Apr |
| 2009 | 20.4 |
| 2010 | 22.8 |
| 2011 | 6.6 |
| 2012 | (14.1) |
| 2013 | 1.1 |
| 2014 | 23.2 |
| 2015 | 14.7 |
| 2016 | 66.4 |
| 2017 | (14.2) |
| 2018 | 33.8 |
| 2019 | 4.2 |
Figure 6 – ERX year-by-year March-April total return
Summary
I personally have not pulled the trigger and committed money specifically to the energy sector based on an expectation that it will soon turn around. As an “Old Dog” I guess I am looking for some sort of catalyst or at least some signs of life first. Shoot, I guess I won’t be buying the bottom (hey, why break precedent now?).
But I will be watching especially closely as the month of March draws closer.
Jay Kaeppel
Disclaimer: The information, opinions and ideas expressed herein are for informational and educational purposes only and are based on research conducted and presented solely by the author. The information presented does not represent the views of the author only and does not constitute a complete description of any investment service. In addition, nothing presented herein should be construed as investment advice, as an advertisement or offering of investment advisory services, or as an offer to sell or a solicitation to buy any security. The data presented herein were obtained from various third-party sources. While the data is believed to be reliable, no representation is made as to, and no responsibility, warranty or liability is accepted for the accuracy or completeness of such information. International investments are subject to additional risks such as currency fluctuations, political instability and the potential for illiquid markets. Past performance is no guarantee of future results. There is risk of loss in all trading. Back tested performance does not represent actual performance and should not be interpreted as an indication of such performance. Also, back tested performance results have certain inherent limitations and differs from actual performance because it is achieved with the benefit of hindsight.

