In this article I wrote about a method using Fidelity Select Sector funds and in this article about using single-country ETFs.
The method was about as simple as it gets:
*Whichever security among the given list (sector funds or single-country ETFs) performed the best during the month of September is bought on October 31st and held, a) until the end of May for sector funds) or, b) until the end of April for single-country ETFs.
As always, I pointed out that actually utilizing the “idea” was not a “recommendation” but rather, well, an idea.
In this article, let’s combine the two into one strategy and bring things up-to-date.
The Combined September Barometer Approach (CSBA)
At the end of each September, using monthly total return data (which is typically not available until sometime in early October):
Buy Rules:
*Identify the Fidelity Select Sector fund that had the highest total return during September and buy it on October 31st.
*Among the 16 iShares single-country ETFs that launched in 1996 (list below) identify the ETF that had the highest total return during September and buy it on October 31st.
Sell Rules:
*Sell the single-country ETF on the last trading day of the following April
*Sell the sector fund on the last trading day of the following May
*For testing purposes, all proceed go into intermediate-term treasuries. For this we will use ticker FGOVX as a proxy (so for the record, the sector fund portion of the portfolio holds FGOVX from Jun 1 through Oct 31 and the single-coutry ETF portion hold FGOVX form May 1 through Oct 31).
As a benchmark we will use 50% in the S&P 500 Index and 50% in the MSCI EAFE Index, rebalanced at the start of every year.
Figure 1 displays the cumulative hypothetical growth for CSBA versus the benchmark.

Figure 1 – Growth of $1,000 invested in CSBA (blue) versus the benchmark SPX/EAFE Index (red); 1996-2019
Figure 2 displays some relevant facts and figures.

Figure 2 – Facts and Figures (FGOVX held when not in sector funds/single country ETFs)
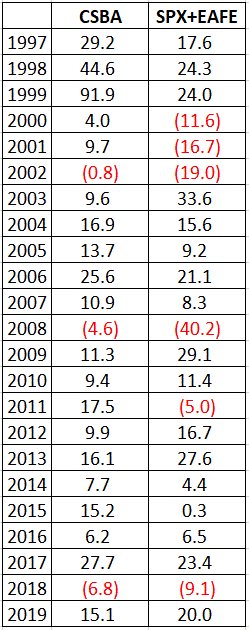
Figure 3 displays calendar year results.

Figure 3 – Calendar Year Results (FGOVX held when not in sector funds/single country ETFs)
*For the record, CSBA showed a calendar year gain in 20 out of 23 years, versus 17 out of 20 for the benchmark. CSBA outperformed the benchmark in 16 out of 23 years.
*One other interesting thing to note is that during the 6 calendar years when the benchmark showed a loss (2000,2001,2002,2008,2011,2018), the CSBA outperformed the benchmark – usually by a significant amount, and actually showed a gain during 3 of those years.
Figure 4 displays the funds/ETFs held each year and the amount gained or lost during that fund/ETFs holding period (7 months for sector funds, 6 months for single country ETFs)

Figure 4 – Annual sector fund/single-country holdings/Results
Summary
So, is the Combined September Barometer Approach a viable approach to investing? That’s not for me to say. Again – and as always – what is presented here is not a recommendation to “do a certain thing.” The purpose is simply to highlight that there may be ways to do better in the markets than just buying and holding an index fund.
Original single-country ETF list (traded since 1996)

Figure 5
Jay Kaeppel
Disclaimer: The information, opinions and ideas expressed herein are for informational and educational purposes only and are based on research conducted and presented solely by the author. The information presented does not represent the views of the author only and does not constitute a complete description of any investment service. In addition, nothing presented herein should be construed as investment advice, as an advertisement or offering of investment advisory services, or as an offer to sell or a solicitation to buy any security. The data presented herein were obtained from various third-party sources. While the data is believed to be reliable, no representation is made as to, and no responsibility, warranty or liability is accepted for the accuracy or completeness of such information. International investments are subject to additional risks such as currency fluctuations, political instability and the potential for illiquid markets. Past performance is no guarantee of future results. There is risk of loss in all trading. Back tested performance does not represent actual performance and should not be interpreted as an indication of such performance. Also, back tested performance results have certain inherent limitations and differs from actual performance because it is achieved with the benefit of hindsight.

