Everyone wants to make money. In fact, human nature being what it is, most people would like to make as much as they can. But when it comes to actually investing one’s money there is also the “risk” side of the equation to factor in. And that’s where the trouble typically comes in.
Human nature also being what it is, some segment of the investing population essentially ignores risk – at least right up until the point where the equity in their account experiences a harrowing decline. Another segment (comprised in no small part from former members of the previous group) place almost all of their attention on “risk avoidance.” And from an “I like to sleep at night” perspective that can make sense. Unfortunately, what tends to happen is 20-30 years down the road, instead of retiring with $x, they retire with a small fraction of the wealth they might have accumulated if they had taken a little more risk now and then. So, the bottom line leads us directly to….
Jay Trading Maxim #22: Investment success is not about maximizing return or minimizing risk. Investment success is about maximizing the tradeoff between reward and risk – i.e., finding the balance that is right for you, and not someone else.
What follows is “one approach” to balancing reward and risk.
One Slow and Steady Approach
The following “system” is NOT a recommendation – just food for thought. It combines a seasonal element with 3 asset classes to create an investment “calendar.”
The results use historical index data only, although there are ETF’s available to track the indexes.
The Data
The test uses index data starting in January 1991 through August 2019 as shown below.
| Index Name | ETF |
| Bloomberg Barclays High Yield Very Liquid Index | HYG |
| S&P 500 Low Volatility Index | SPLV |
| Bloomberg Barclays Treasury Intermediate Index | IEI |
Figure 1 – The Vehicles
The Calendar
| Month | Index Held |
| Jan | Bloomberg Barclays High Yield Very Liquid Index |
| Feb | Bloomberg Barclays High Yield Very Liquid Index |
| Mar | S&P 500 Low Volatility Index |
| Apr | S&P 500 Low Volatility Index |
| May | S&P 500 Low Volatility Index |
| Jun | Bloomberg Barclays Treasury Intermediate Index |
| Jul | Bloomberg Barclays Treasury Intermediate Index |
| Aug | Bloomberg Barclays Treasury Intermediate Index |
| Sep | Bloomberg Barclays Treasury Intermediate Index |
| Oct | Bloomberg Barclays Treasury Intermediate Index |
| Nov | S&P 500 Low Volatility Index |
| Dec | S&P 500 Low Volatility Index |
Figure 2 – Jay’s Slow and Steady Strategy Calendar
The Results
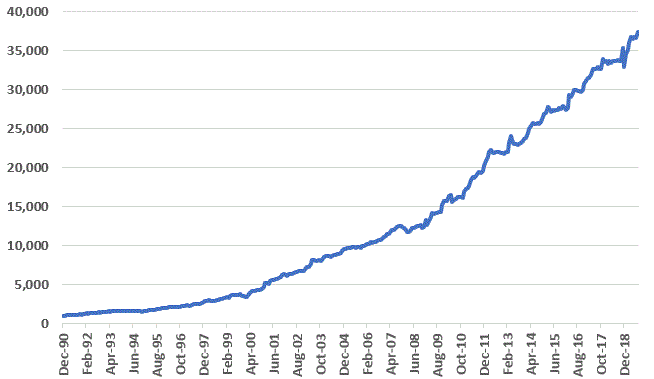
Figure 3 displays the growth of a hypothetical $1,000 invested using the calendar/indexes above.

Figure 3 – Hypothetical growth of $1,000 invested using Jay’s Slow and Steady Calendar
Figure 4 displays some relevant reward and risk numbers for the system.
| Measure | Value |
| Average 12-mos % +(-) | +13.7% |
| Median 12-mos. % +(-) | +12.8% |
| Std. Deviation of 12-mos. % +(-) | 8.6% |
| Average/Std. Deviation | 1.59 |
| Worst 12-month % | (-3.3%) |
| Maximum Drawdown % | (-7.4%) |
| Average 5-Yr. % +(-) | +94.0% |
| Worst 5-Yr. % +(-) | +38.5% |
Figure 4 – Facts and Figures
Key things to note:
*The system has a very low 12-month standard deviation – i.e., low volatility.
*The worst 12-month period was -3.3% and the worst drawdown (to date) was -7.4%. That falls within most investors risk tolerance levels.
*100% of all 5-year rolling periods showed a gain.
Summary
Is Jay’s Slow and Steady Calendar Strategy the “best” way to invest for an investor looking for a decent tradeoff between reward and risk? Hardly. But it’s one way…
Jay Kaeppel
Disclaimer: The data presented herein were obtained from various third-party sources. While I believe the data to be reliable, no representation is made as to, and no responsibility, warranty or liability is accepted for the accuracy or completeness of such information. The information, opinions and ideas expressed herein are for informational and educational purposes only and do not constitute and should not be construed as investment advice, an advertisement or offering of investment advisory services, or an offer to sell or a solicitation to buy any security.


Can you pls run it with IVV or SPY instead of the “low vol” version. Would be good to see the impact of the “low vol” bias! Cheers!
If one’s mutual fund family (not using ETF’s) doesn’t have a low vol fund is there a way to reduce the volatility or at least the risk comparable to a low vol fund, e.g. position sizing? How would one do this?
Thanks.
Mutual funds that correlate most closely are dividend or equity income funds and maybe some balanced funds. But it is a different dynamic so I can’t speak to what actual results would look like. My guess – and it is nothing more than that – is that a dividend fund in place of SPLV would produce slightly lower returns over time with slightly higher volatility and drawdowns. Jay
Thanks for posting this concept of a low volatility trading system. I would like to work on this a bit. Do you know of a source for the daily Barclay index histories? I realize that I can pull the daily ETF data…just hoping to test further back.