As the saying goes, “It Doesn’t Have to Be Rocket Science” (unless of course you are actually trying to launch a rocket, in which case it is pretty darned important, but I digress). When it comes to the stock market, quite often the “simple” can often work just as well or better than the “complex.”
Two Simple Factors
The first seasonal factor is the January Barometer, first developed and popularized by Yale Hirsch of The Stock Market Barometer. The simple theory was “as January goes, so goes the rest of the year.” In reality, it is more like, “If January is Up get bullish for the rest of the year, if January is down, well, you’re on your own.” Figure 1 displays the growth of $1,000 in ested in the S&P 500 Index from the end of January to the end of December only during those years (starting in 1940) when the S&P 500 Index registered a gain in the month of January.
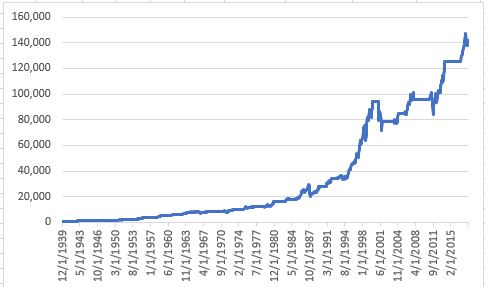
Figure 1 – Growth of $1,000 in SPX for rest of year when SPX is UP in January (1940-2018)
For the record, the net cumulative gain for the S&P 500 Index during February through January, depending on whether January is UP or DOWN works out like this:
January UP: Cumulative gain = +14,064%
January DOWN: Cumulative gain = +53%
Bottom line: A down January tells us basically nothing. But an UP January tends to provide useful information (despite the fact that SPX has lost -3.7% in the 5 months since posting an UP January 2018).
The other factor we will look at here should probably not be categorized as “seasonal” but rather as “price based.” It works like this:
If the S&P 500 Index shows a gain for 4 consecutive months then remain bullish for the next 12 months (NOTE: Within those 12 months, if SPX registers a down month and then stages 4 more consecutive up months, then the bullish period can be extended for another 12 months from that point). Figure 2 displays the growth of $1,000 invested in SPX only when the indicator I just described is bullish.
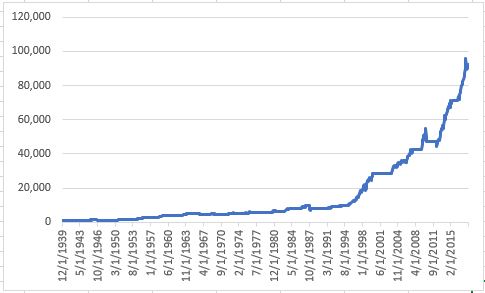
Figure 2 – Growth of $1,000 invested in SPX for 12 months after SPX registers four consecutive UP months (1940-2018)
Putting the Two Together
Now let’s combine the two (“January Barometer” and “Four Up Months”). Figure 3 displays the growth of $1,000 invested in SPX ONLY when BOTH indicators are bullish at the same time.
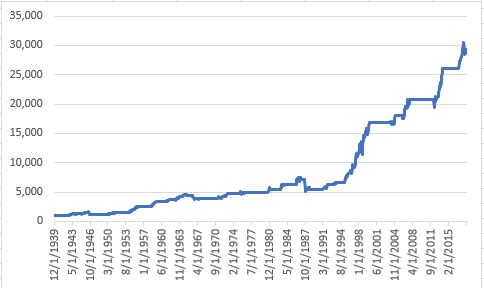
Figure 3 – Growth of $1,000 ONLY when BOTH of the indicators are bullish (1940-2018)
Figure 4 displays the growth of $1,000 invested in SPX ONLY when NEITHER of the indicators is bullish (FYI: net result = -51%)
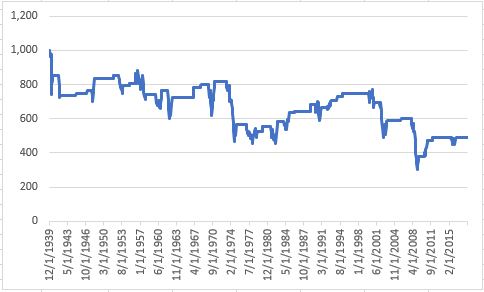
Figure 4 – Growth of $1,000 ONLY when NEITHER of the indicators are bullish (1940-2018)
Notice any difference in market performance between Figures 3 and 4?
Figure 5 displays more of a “systematic” approach. It invests SPX when EITHER OR BOTH of the indicators are bullish and holds cash (earning a nominal rate of interest of 1% per year). The red line displays the growth of $1,000 invested in SPX using a buy-and-hold approach.
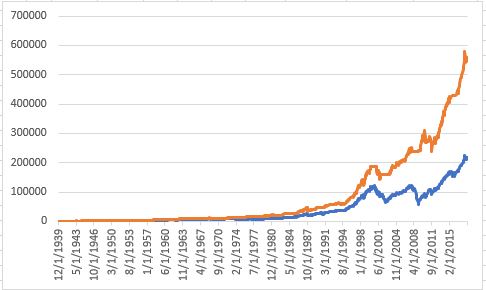
Figure 5 – Growth of $1,000 invested in SPX when EITHER of the indicators is bullish and earning 1% annual interest when in cash (orange line), versus buy-and-hold (red line); 1940-2018
Summary
*The “system” was in the stock market 71% of the time
*The “system” gained +55,793%
*”Buy-and-Hold” gained +21,664%
Now for the caveats: No one should simply assume that this is a “world beater” approach to investing or that past hypothetical performance guarantees futures results. The “system” turned fully bullish at the end of January 2018 and the market has been (with the exception of small-caps and FANG stocks) has been anywhere from “meh”, to fairly dreadful. So we’ll see what the future holds.
The only thing this does really proves is that “It doesn’t have to be rocket science.” Two incredibly simple indicators in combination have beaten the market by a factor of 2.57-to-1 over the past 77+ years.
That’s something to think about.
Jay Kaeppel
Disclaimer: The data presented herein were obtained from various third-party sources. While I believe the data to be reliable, no representation is made as to, and no responsibility, warranty or liability is accepted for the accuracy or completeness of such information. The information, opinions and ideas expressed herein are for informational and educational purposes only and do not constitute and should not be construed as investment advice, an advertisement or offering of investment advisory services, or an offer to sell or a solicitation to buy any security.

