OK I suppose it would have been helpful to highlight this one a little sooner, but since the purpose of this blog is to “educate” and not to “prompt trading actions” I guess anytime is a good time, right?
Fidelity Select Biotech fund (ticker FBIOX) stocks bounced off of a low in April after falling 18% in less than a month. So far in May it is up almost 6%. An investor aware of the seasonal tendencies in biotech stocks would not be surprised by this development. For as it turns out, May, June and July are often (although importantly, not always) something of a “sweet spot” for biotech stocks.
FBIOX Spring into Summer
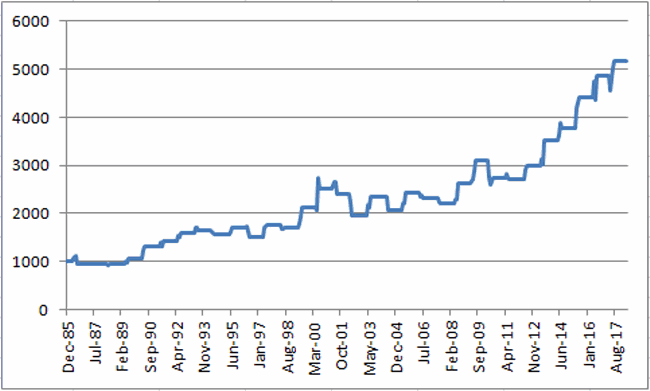
Figure 1 displays the growth of $1,000 invested in FBIOX only during the months of May, June and July every year since the fund started trading in 1986. Figure 1 – Growth of $1,000 invested in FBIOX during May, June and July; 1986-2017
Figure 2 displays the year-by-year results.
Figure 2 – Year-by-Year FBIOX May-July %+(-)
Figures to note regarding FBIOX during May through July from 32 years of data:
*UP 20 times (63% of the time)
*DOWN 12 times (37% of the time)
*Average Up = +13.4%
*Average Down = (-6.7%)
*Median Up = +13.7%
*Median Down = (-5.0%)
*Maximum Up = +22.9% (1999)
*Maximum Down = (-18.3%) (2002)
Summary
Clearly biotech stocks have “tended” to perform well during this time of year. Yet, it is also clearly not a “sure thing” and as the 2002 results highlight, there is always risk in the markets.
The purpose of this article is not to try to induce you to buy biotech stocks. The purpose is to highlight;
Jay’s Trading Maxim #27: Long-term investment success is not about finding “sure things” but about finding a slight edge here and there and exploiting it ruthlessly and repeatedly.
Jay Kaeppel
Disclaimer: The data presented herein were obtained from various third-party sources. While I believe the data to be reliable, no representation is made as to, and no responsibility, warranty or liability is accepted for the accuracy or completeness of such information. The information, opinions and ideas expressed herein are for informational and educational purposes only and do not constitute and should not be construed as investment advice, an advertisement or offering of investment advisory services, or an offer to sell or a solicitation to buy any security.


Jay,
I’ve been reading your posts for a bit and definitely enlightening to view your perspective on things. Do you happen to have a subscription to your blog? Thanks for all your insights and perspective on things.
Thanks,
KD
KD, Thank you for the comments. I don’t really have a subscription per se, but if you would like me to add you to my email list just let me know. Jay
Jay, how does this compare with a buy and hold on FBIOX, and are you confident in your numbers? Just comparing your stats above from 2008-2017 with Fidelity’s website, the May-Jul method averaged 9.36% while the B&H averaged 18.42%. Maybe it is a good method over 32 years, but it seems to be a laggard over the past 10 years. How does that saying go, “what have you done for me lately?” …… Keith
Keith, The purpose of this kind of analysis is essentially to try to find “high probability” situations. In other words, more of a “hit and run” approach, i.e., this method is only in FBIOX for three months per year. So it isn’t really meant to be compared to buying and holding. Also, buying and holding FBIOX over 32 years has made alot of money – as long as one is willing to ride the occassional -45% to-75% decline – which is what this type of analysis attempts to avoid. Hope that helps. Jay