Monthly Archives: April 2018

Yes, the U.S. Dollar is at a Critical Juncture

If you have read any of my pieces lately you are already aware that as it relates to the financial markets a lot of things are presently at a critical juncture (including my sanity, but I digress).  Today let’s add the U.S. Dollar to that seemingly ever longer list of financial areas that appear to be at a crossroads.  And this one has some large implications simply because a lot of other markets are affected at least to some extent by what happens in the dollar.

Figure 1 displays the Spot U.S. Dollar on a monthly basis.

1Figure 1 – U.S. Dollar Monthly (Courtesy ProfitSource by HUBB)

The reality is that there is no one definitive price at which to draw a “definitive” line in the sand.  So I arbitrarily picked two.  There is nothing “magical” about these two lines and a move above or below either does not technically “prove” anything.  Still, as far as this range goes, a lot of previous price moves have “gone here to die” so to speak.

Now this is the point in the article where a skilled analyst would explain in painstaking detail why the dollar is absolutely, positively destined to move higher (or lower) from here.  Sorry, folks I honestly don’t know. But there are two things I do know which might still prove useful:

1) For every prognosticator out there pounding the table that the dollar is sure to move higher there is another (equally slightly crazed) prognosticator averring that the dollar is destined to decline.  And the key thing to note is that they both can make a pretty compelling case.

2) A lot rides on which way the dollar goes from here, because there is no shortage of markets that react – at least in part – to the movements of the U.S. dollar.  This means that alot of trading opportunities will be affected/created by the next big move from the dollar.

A few examples appear in Figure 2 below which displays the inverse nature of the correlation between the U.S. Dollar (using ticker UUP as a proxy) and the market in question (for the record, a figure of 1000 means the market moves exactly like the dollar and a figure of -1000 means the market moves exactly inversely to the dollar).

2

Figure 2 – Correlations to U.S. Dollar (Courtesy AIQ TradingExpert)

Now the fact that foreign currencies (ticker FXE – which tracks the Euro) move inversely to the U.S. Dollar is fairly obvious.  But note that on this list are:

*Foreign Bonds and U.S. Bonds (BWX and TLT)

*Precious Metals (GLD and SLV)

*Commodities (like coffee, soybeans and crude oil)

*Broad Commodity Indexes (DBC and GSG)

This encompasses a pretty darn wide swath of the trading world.  And every single one of them will be influenced to some extent by which way the dollar goes from here.

As you can see in Figures 3 through 6 (click to enlarge any of the charts), what happens to the U.S. Dollar can matter a lot to what happens in these markets.3Figure 3 – Dollar vs. Euro (Courtesy AIQ TradingExpert)

4Figure 4 – Dollar vs. Bonds (Courtesy AIQ TradingExpert)
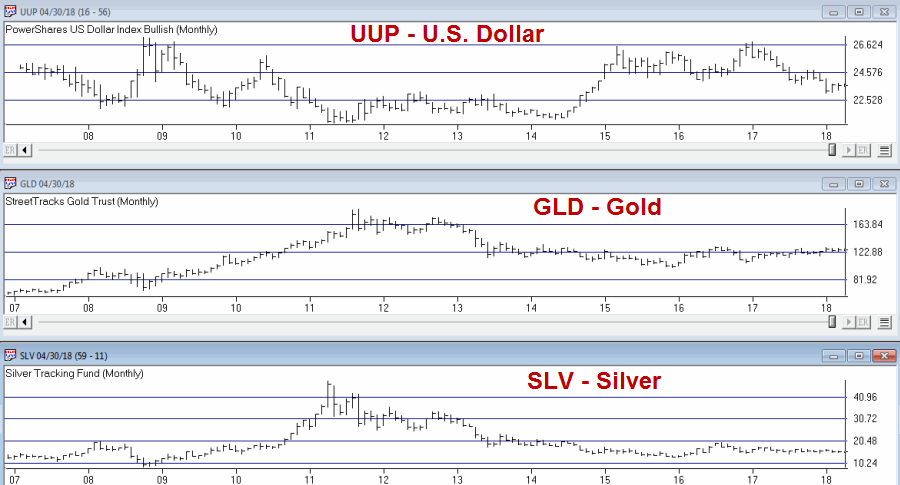
5Figure 5 – Dollar vs. Metals (Courtesy AIQ TradingExpert)

6Figure 6 – Dollar vs. Commodity Indexes (Courtesy AIQ TradingExpert)

Summary

So the bottom line is that I do not know which way the dollar goes from here.  But I do know that whichever way it goes a lot of “things” will likely go “the other way.”  And everything listed in Figure 2 represents a lot of trading opportunities.

This represents a good time to invoke:

Jay’s Trading Maxim #17: (with credit given to George and Tom at Optionetics back in the day): Investing success involves two “simple” steps. #1) Spot opportunity.  #2) Exploit opportunity.  Everything you do as a trader or investor falls into one of these two categories.

A bunch of opportunities may soon be spotted (assuming the dollar actually ever does get around to deciding which way it wants to go…).

So focus here, people, focus…

Jay Kaeppel

Disclaimer:  The data presented herein were obtained from various third-party sources.  While I believe the data to be reliable, no representation is made as to, and no responsibility, warranty or liability is accepted for the accuracy or completeness of such information.  The information, opinions and ideas expressed herein are for informational and educational purposes only and do not constitute and should not be construed as investment advice, an advertisement or offering of investment advisory services, or an offer to sell or a solicitation to buy any security.


Yes, Gold is at a Critical Juncture

I saw a headline recently touting the “confirmed upside breakout” for Gold.  As I tend to follow the markets, ahem, somewhat closely, I was a bit surprised that I somehow missed this.  So imagine my confusion when I pulled up a bar chart to see the “confirmed upside breakout” that I somehow missed and saw what appears in Figure 1.

1Figure 1 – Daily Spot Gold (Courtesy ProfitSource by HUBB)

Um, not to be trendy but, “dude, where’s my breakout?”  All I see in this chart is serious resistance in the $1,370-$1,380. So was this pundit off his rocker?  Turns out, no not necessarily.  For if we switch to a monthly chart we can see exactly what he was referring to.2Figure 2 – Monthly Spot Gold (Courtesy ProfitSource by HUBB)

So, yes it is possible to make the case that gold has “broken out” to the upside.  Still, if you put the two together you get Figure 3.3Figure 3 – Monthly Spot Gold (Courtesy ProfitSource by HUBB)

So as with most things in the financial markets – it’s all in the eye of the beholder.  You can look at Figures 1 through 3 and reasonably say:

*Gold has broken out to the upside on a long-term basis so I am bullish

*A long-term trend line was broken but there is significant resistance near $1,370-$1,380 so I am going to remain neutral for now

*The resistance level looks pretty solid; I am going to be bearish until that level is taken out.

Take your pick.

In other words, the gold market right now is whatever you want it to be.  So what to do?  Well, let’s say you are the impatient type (“Hi, my name is Jay”) and you want to be positioned for a big move to the upside, but you have serious concerns about if and/or when that move might occur.  Sound intriguing?

Sorry folks, you’ve just been sucked into another lesson on options trading.

The Ratio Backspread

In Figure 4 we see a bar chart for ticker GLD – an ETF that tracks the price of gold bullion with implied option volatility overlaid in black.  4Figure 4 – Ticker GLD with implied volatility (Courtesy www.OptionsAnalysis.com)

You do not have to be an options expert to recognize that IV is presently at the very low end of the historical range. This has several implications. The primary things to know are:

*Low IV means there is relatively less time premium built into GLD option prices, i.e., GLD options are presently “cheap”.

*A subsequent rise in IV should it occur, would serve to inflate the price of GLD options

*Longer-term options are much more sensitive to changes in IV that shorter-term options.  Therefore, if IV does rise, longer-term options will increase more in value than shorter-term options.

So let’s consider a possibility. IMPORTANT: As always I need to point out that what follows is simply an example of “one way to play” and I am in no way “recommending” this trade nor implying that it will generate a profit.  It is presented solely as a means to teach people the relative advantages and disadvantages of various option trading strategies in a given circumstance.  Are we clear?

The trade displayed in Figures 5 and 6 involves:

*Selling 1 Dec31 GLD 119 calls @ $10.60

*Buying 2 Dec31 GLD 126 calls @ $5.23

5Figure 5 – GLD ratio backspread (Courtesy www.OptionsAnalysis.com)

6Figure 6 – GLD ratio backspread risk curves (Courtesy www.OptionsAnalysis.com)

This trade has 270 days left until expiration and the maximum risk is -$886 if GLD closes at exactly $130 a share on 12/31/2018 (and wouldn’t that be just my luck?).  As you can see in Figure 6:

*If GLD rallies this trade can make a lot of money

*If GLD remains unchanged eventually this trade will lose money

*If GLD tanks this trade will breakeven or experience at most a small loss

Also, if IV rises in the meantime, that would push the risk curves further into positive territory. For example, if IV rose from 12% to 16% (i.e., 33%), the risk curves would look like those in Figure 7.7Figure 7 – GLD ratio backspread risk curves if implied volatility increases 33% from current levels (Courtesy www.OptionsAnalysis.com)

Summary

Which way will gold goal from here?  It beats me.

Will GLD implied options volatility increase from here?  It beats me.

Will the example trade above generate a profit?  It beats me.

OK, not exactly the “rip roaring, go to the mattresses, take no prisoners, Katie bar the door” summary you might have been hoping for.  So let me sum it up in a series of questions you can answer at home:

Question 1: Do you think there is a chance gold will rally between now and the end of the year?

Question 2: Do you think there is a chance that GLD implied option volatility will pick up sometime between now and the end of the year?

Question 3: Do you have $886 bucks?

Jay Kaeppel

Disclaimer:  The data presented herein were obtained from various third-party sources.  While I believe the data to be reliable, no representation is made as to, and no responsibility, warranty or liability is accepted for the accuracy or completeness of such information.  The information, opinions and ideas expressed herein are for informational and educational purposes only and do not constitute and should not be construed as investment advice, an advertisement or offering of investment advisory services, or an offer to sell or a solicitation to buy any security.


What a Difference a Day Makes

In this article I made the argument that at that time we really are at a critical juncture in the stock market.  Every once in a while a critical “line in the sand” is drawn and which side of the line the market sits has significant implications for future price direction and for investors in general.  The Feb-March 2018 consolidation is one of those times (at least it seems that way in my market addled brain).

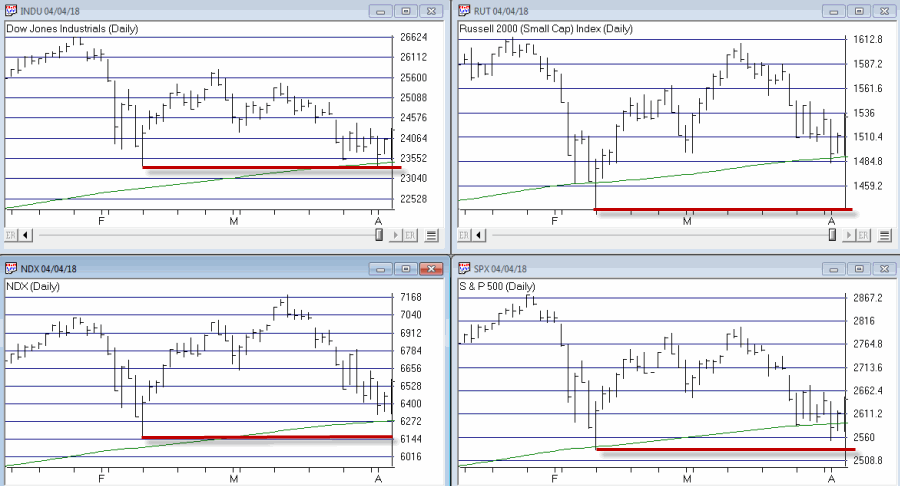
Figure 1 below is the same Figure 1 from the previous article with one more day of data added.  On the last day in the chart the stock market opened sharply lower and the whole thing pretty much seemed to hang in the balance.  From there the market rallied sharply higher for the remainder of the day.1aFigure 1 – Major indexes bounce (Courtesy AIQ TradingExpert)

This reminds me of one of my favorite phrases:

*That which does not kill us only serves to make us stronger.

For the market is more like this:

Jay’s Trading Maxim #44: That decline which severely tests, but does not violate, a crucial support level only serves to make that support level stronger.

So “Happy Days are here again?”  Well, um, there’s the rub.  With the stock market it’s never fully possible to “declare victory”, because this time could always be different and everything can change tomorrow.  The bottom line is that I do not possess the ability to “predict” what will happen next in the market.  But here is what I do (think I) know.  The Feb-March lows are a crucial “line in the sand”.

So what follows is a handy guide for investors:

*Major Indexes remain above Feb-March Lows = GOOD

*Major Indexes drop below Feb-March Lows = BAD (in fact, possibly VERY BAD)

Since yesterday was something of a victory for the “clinging to the side of the ship” bulls let’s let the bullish flag fly.  Below are two “bullish outlook” charts along with the links to the original articles that appeared on www.McVerryReport.com.

Figure 2 compares the market movement from the breakout in 2013 to previous bull runs.  This chart suggests that the current bull market could still have a long ways to go.2Figure 2 – 1950, 1980 and 2013 breakouts (Source: HORAN Capital Advisors)

Figure 3 makes an Elliott Wave argument for the S&P 500 Index to soar from here.

3Figure 3 – The case for SPX 3070 (Source: deflationland.blogspot.com)

For the record, I don’t necessarily agree or disagree, endorse nor disavow the analysis in these charts.  I am merely pointing out that as long as support holds – and as long as an investor stands ready to take defensive action if things go south – there is no reason not to focus on “upside potential.”

So Yippee Kyay!

Alright, enough of this bullish revelry.  I need to get back to being paranoid… because the reality remains that the party could end as early as today.

Vigilance, people, vigilance.

Jay Kaeppel

 Disclaimer:  The data presented herein were obtained from various third-party sources.  While I believe the data to be reliable, no representation is made as to, and no responsibility, warranty or liability is accepted for the accuracy or completeness of such information.  The information, opinions and ideas expressed herein are for informational and educational purposes only and do not constitute and should not be construed as investment advice, an advertisement or offering of investment advisory services, or an offer to sell or a solicitation to buy any security.

“Yes”, We are at a Critical Juncture

There are times when the market just moves along from day-to-day and us “junkies” might hang on every move but to the average investor what happens today or tomorrow is really not all that meaningful in the whole big spectrum of things.

And then there are times like now.  As you can see in Figure 1, the major market indexes are struggling and are testing their respective 200-day moving averages.  How this “dance” plays out may have important implications for virtually all stock market investors.

(click to enlarge)1Figure 1 – Major indexes “on the edge” (Courtesy AIQ TradingExpert)

First off let me say this: There is nothing “magic” about a 200-day moving average.  It was interesting that the other day when the S&P 500 Index closed below its 200-day average (it was the only major index to do so) roughly 22,367 articles appeared on the internet sounding the alarm.  Now I do pay a lot of attention to moving averages, but more to get a sense of trend than as automatic buy and sell triggers.  Which leads me to invoke:

Jay’s Trading Maxim #81: Contrary to popular belief, a price drop below a “key” moving average does NOT imply the onset of immediate and total Armageddon.

And

Jay’s Trading Maxim #81a: Um, but it could. So best to pay attention.

3 Possibilities

Actually there are a few others but the most likely outcomes – and the implications – are:

1. A reversal back to the upside – If the major averages hold here above their recent lows.  If this happens a strong rally to the upside is a strong possibility. Which is one reason it is too soon to “jump ship.”

2. A breakdown by all major indexes – If a majority of the major indexes break down below their recent lows investors are urged to take defensive measure.  Whether that involves selling shares/funds/ETFs/etc or hedging with options and/or inverse products is up to each investor.

3. A whipsaw – One other dreaded possibility involves both of the above – i.e., the average break down far enough briefly to trigger a defensive action only to quickly reverse back to the upside. This often leaves a lot of investors standing there dumbstruck and unable to pull the trigger to get back in.

Like I said, this is a critical juncture.  Whatever happens, investors need to pay attention and stand ready to, a) do nothing, or, b) take defensive action, or, c) take defensive action and then undo the defensive action and get bullish again (in the event of a whipsaw).

Steady, people, steady….

Jay Kaeppel

Disclaimer:  The data presented herein were obtained from various third-party sources.  While I believe the data to be reliable, no representation is made as to, and no responsibility, warranty or liability is accepted for the accuracy or completeness of such information.  The information, opinions and ideas expressed herein are for informational and educational purposes only and do not constitute and should not be construed as investment advice, an advertisement or offering of investment advisory services, or an offer to sell or a solicitation to buy any security.