Here’s a fun thing to do. If you want to get somebody to give you a weird look tell them that there is a good chance that commodities will outperform stocks in the next 3 to 8 years. In the immortal words of Ralph Parker, they will look at you “like you have lobsters crawling out of your ears.”
But a glance at Figure 1 explains why this seemingly crazy notion may not be so farfetched. Figure 1 displays the Goldman Sachs Commodity Index (GSCI) divided by the S&P 500 Index (SPX). As you can see, this ratio “goes to extremes” and the move from one extreme to another typically takes a number of years to play out.
 Figure 1 – Goldman Sachs Commodity Index divided by S&P 500 Index
Historically, commodities vastly outperform stocks for a period of several years, then everything reverses and stocks vastly outperform commodities. This ratio recently hit an all-time low as commodity prices fell while the stock market experienced a huge bull market. This suggests (though certainly does not guarantee) that the next big move will involve commodities outperforming stocks.
Figure 2 displays a monthly bar chart for ticker RJI (the ELEMENTS Rogers International Commodity Index – Total Return) which is an ETF that holds a basket of commodities. What we see is that a long-term down trending trend line, as well as a key “once support/then resistance” level ($5.27 a share) have both been pierced to the upside.
Which causes me to raise the obvious question “is this a breakout?”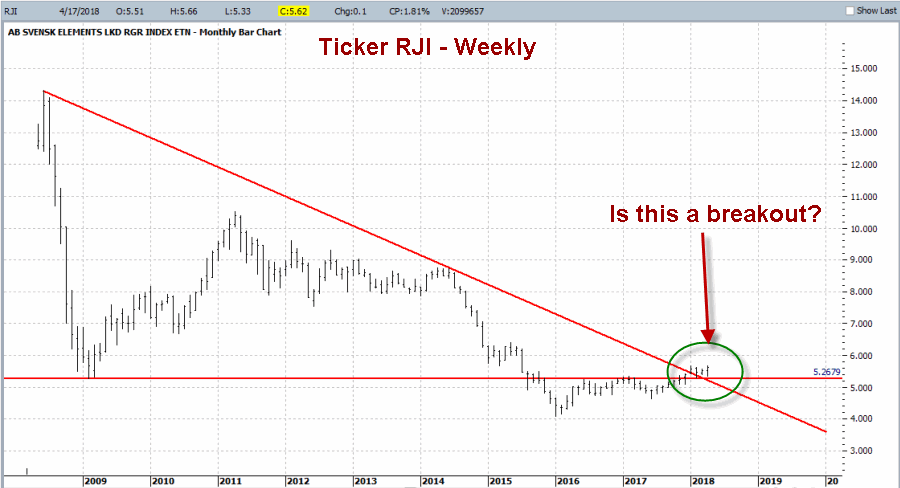 Figure 2 – RJI Monthly Bar chart with potential signs of a breakout (Courtesy ProfitSource by HUBB)
Before getting too carried away and making wild-eyed proclamations about how the turn in the GSCI/SPX Ratio has begun, let’s consider a few other “things.”
Figure 3 displays the daily chart for RJI. The red lines inFigure 2 are the same red lines drawn onthe monthly chart in Figure 2. As you can see, on a short-term basis there is an obvious “line in the sand/resistance” level at $5.66 a share. Unless and until RJI clears that level it is probably premature to talk about being “off to the races.”
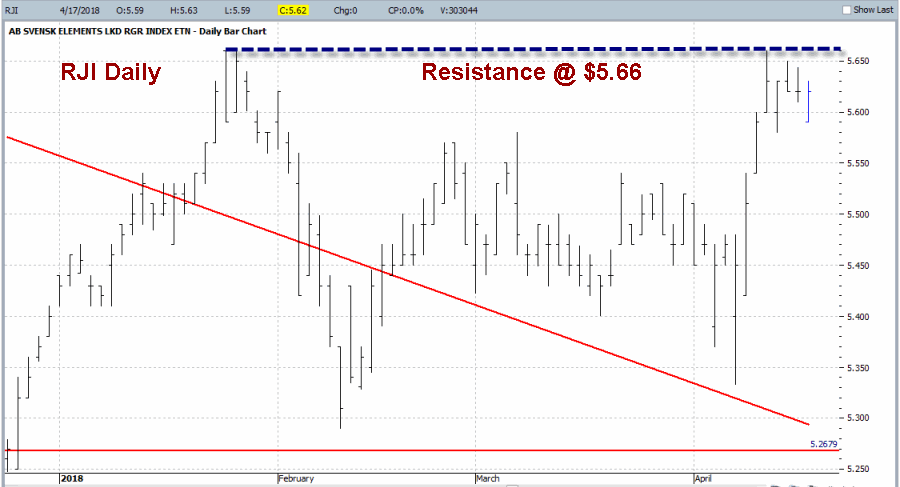 Figure 3 – RJI Daily w/short-term resistance (Courtesy ProfitSource by HUBB)
It should be noted that there are other commodity ETFs available and that they presently paint a slightly different picture. This is due to the fact that each tracks a different basket of commodities, with varying weights assigned to varying commodities.
Figure 4 displays a monthly chart of ticker DBC (PowerShares DB Commodity Index Tracking Fun) and ticker 5 displays ticker GSG (iShares S&P GSCI Commodity-Indexed Trust (which is designed to track the S&P GSCI Total Return Index).
 Figure 4 – DBC Monthly (Courtesy ProfitSource by HUBB)
 Figure 5 – GSG Monthly (Courtesy ProfitSource by HUBB)
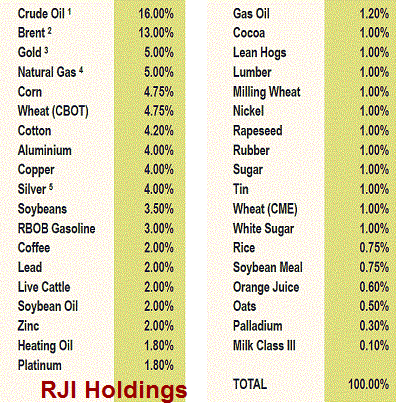
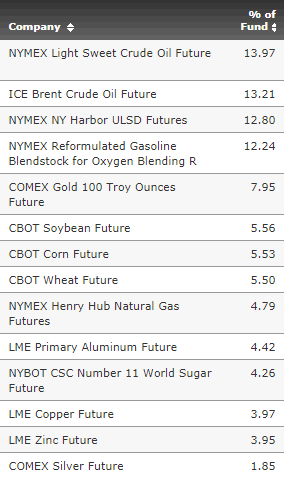
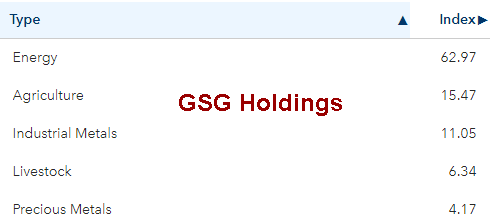
As you can see in Figures 4 and 5, tickers DBC and GSG appear to paint a slightly different – seemingly less bullish – case for commodities. Why the difference? Figures 6, 7 and 8 display the portfolio holdings for RJI, DBC and GSG respectively. The key thing to note is that RJI is the most diversified of the three. Also RJI holds roughly 40% of its portfolio in energies whereas DBC and GSG hold roughly 56% and 63% of their respective portfolio in energy related commodities (crude oil, natural gas, etc.). It should be noted that these holdings and the percentages can change over time.
Figure 6 – RJI holdings
Figure 7 – DBC holdings
Figure 8 – GSG holdings
Summary
*Based on Figure 1 I do believe that commodities may in fact outperform stocks (possibly by a significant margin) in the years ahead.
*Based on Figure 2 I think it is possible that commodities may start gaining significant ground sooner than later.
*However, based on Figures 3, 4 and 5 I am tempering my enthusiasm for the time being.
*If history (referring to the long-term swings in the GSCI/SPX ration displayed in Figure 1) is an accurate guide (and of course in the financial markets it is always important to remember that “yes, this time could be different”) there is no need to try to “pick the turn” in the GSCI/SPX ratio. We can wait for a new trend to develop first before “taking the plunge.”
*But now appears to be a good time to be keeping a close watch on commodities versus stocks.
Jay Kaeppel
Disclaimer: The data presented herein were obtained from various third-party sources. While I believe the data to be reliable, no representation is made as to, and no responsibility, warranty or liability is accepted for the accuracy or completeness of such information. The information, opinions and ideas expressed herein are for informational and educational purposes only and do not constitute and should not be construed as investment advice, an advertisement or offering of investment advisory services, or an offer to sell or a solicitation to buy any security.


My take on the RJI chart (currently at 5.71)shows a breakout , especially on the weekly. What concerns me is how thinly traded this etf is — less than 16,000 shares at 10:30 a.m. And if it’s so loaded with energy, why not just buy XLE? Your comments on these points, please.
James, A couple of points; 1) I am not actually “recommending” RJI specifically. Based on Figure 1 I am looking for signs of a ‘turn’ in the GSCI/SPX Ratio and am wondering if the action of RJI might be an ‘early alert’. Also, 2) I am not opposed to buying RJI either. You’re correct that RJI is not terribly active (about 250,000 shares a day), however the “trade” I am talking about could last for years so there is not actually alot of “trading” involved, i.e., unless you’re trading really big volume all at once liquidity is maybe not such a problem.
Regarding XLE, yes all of these “commodity” funds seem to be pretty heavily weighted in energies (I am not actually sure if that is a permanent kind of thing or not). That being said – for better or worse – I would not play XLE, the simple reason being that the “play” I am writing about here is “commodities” versus stocks, not “the single commodity sector that appears to be most heavily weighted in commodity funds.” Jay
Yes, energy has a generally big % in all these commodities indices because it is the deepest, most liquid market in the asset class. BCOM (the old DJ-UBS/AIG) index is the least energy weighted because it has a cap on all sectors of 1/3rd. I would also look at the Invesco Powershares DB indices and of course the Barclays commodities ETFs/ETNs for other choices. Various tax treatments and investment risks apply so you have been warned to do your homework in this space. Jay – if you want to post this in today’s comments that’s fine too if you think it better placed there.
Long-time lurker, first-time commenter.
A few points:
1. Both investments can go down (esp. in a deleveraging / recession scenario – see 2008/2009) but commodities may go down less, thus moving the ratio but generating trading losses.
2. XLE represents energy companies which often hedge out their commodities exposure thus the beta should fit more closely to the stock market as opposed to the commodities market.
3. All ETFs (if properly managed) access the liquidity of their underlying constituents thus often liquidity concerns are often overblown. I would look to the premium/ discount to see if there are genuine concerns.
Thanks for “coming out of the shadows”… Jay
Like a SHARK!
Didn’t you create a bottom picking portfolio of commods to try take advantage of this?