Or something else? That’s the question. As with most things in life it’s all in the way you look at things.
First off, before diving in I will issue my standard warning – if you are not an “options person” and/or never expect to be one, this may not be your “cup of tea.”
A Bear Call Credit Spread in TGT
Right off the bat let me be clear that I am not “recommending” the trade that is discussed here. I am highlighting it because:
a) It serves as an excellent example of a potential opportunity
b) It serves as a useful example
The trade itself involves:
*Selling 1 March09 TGT 80 call @ $0.57
*Buying 1 March09 TGT 85 call @ $0.11
The particulars appear in Figure 1 and the risk curves in Figure 2. Figure 1 – TGT Bear Call Spread particulars (Courtesy www.OptionsAnalysis.com)
 Figure 2 – TGT Bear Call Spread risk curves (Courtesy www.OptionsAnalysis.com)
For serious option trader there are several important considerations here. In no particular order:
*These options expire on March 9, 2018, so at the time of (hypothetical) entry this trade had 8 days left until expiration
*This trade requires $454 to enter
*$454 is the maximum risk and would only be experienced if the trade is held until expiration (March 9) and TGT is at or above $85 a share at that time.
*At the time of (hypothetical) entry TGT stock was trading at $74.13.
*The breakeven price for this trade is $80.46. So as long as TGT stock does anything besides rally 8.5% (from $74.13 to $80.46) in a week+ this trade will show a profit.
*The maximum profit on this trade is $46 (for a 1-lot), or 10.13% of the $454 required to enter the trade, and would be realized if TGT is at $80 a share or less by March 9th.
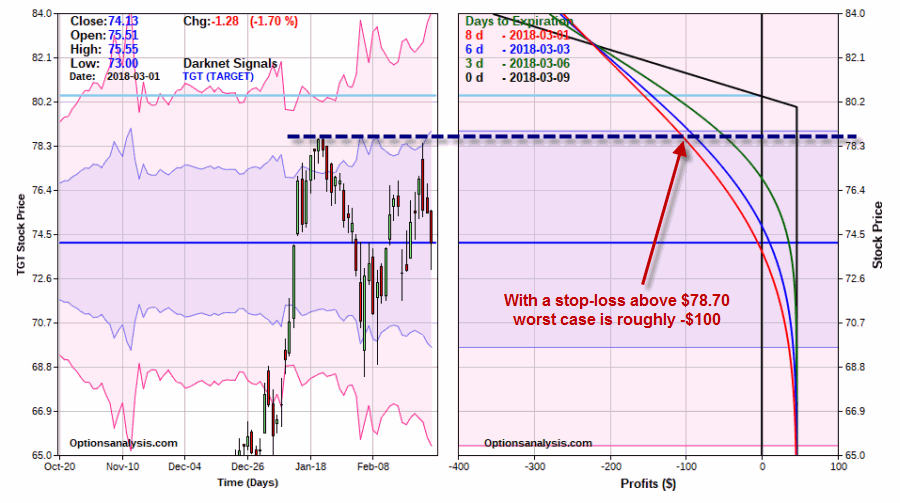
*The breakeven price – importantly – is above the upper resistance price for TGT shares ($78.70). In other words, price has to take out a major resistance level for this trade to lose money.
So one way – the most optimistic way – to look at this trade is encapsulated as:
As long as TGT does NOT rally 8.5% in a week this trade will earn a profit of 10%
Hence the title, “An Easy 10% in a Week?”
But that is NOT the correct way to look at this trade. The question to ask is NOT “What happens if everything goes right?” The proper question to ask for any option trade – particularly one that has more risk than profit potential – is, “What happens if things go wrong.”
To be even more specific, let’s refer to:
Jay’s Trading Maxim #202: If you do not have an answer to “What action(s) will I take if things go wrong?”, then DO NOT make the trade.
Let’s take a closer “hard core” look at the real question associated with this trade.
As you can see in Figure 3 below:
*If TGT is at $80 a share at expiration this trade earns 10.13%, if it is t $80.46 a share this trade breaks even
*HOWEVER, if TGT rises above 80 sooner than later, this trade will accumulate a significant (in relation to the profit potential) open loss.
 Figure 3 – If TGT explodes to the upside (Courtesy www.OptionsAnalysis.com)
So the key question is not “will I make money?” the real question is “what will I do if TGT rallies sooner than later. As the Maxim above states, if you don’t have an answer to the question then don’t make the trade.
Just to complete the example, one possibility in this instance would be to plan to exit or adjust the trade if the resistance level of $78.70 is pierced. See Figure 4. Figure 4 – A possible stop-loss? (Courtesy www.OptionsAnalysis.com)
A stop-loss above resistance of $78.70 yields a worst case loss of roughly $100 (that would occur if TGT hit that price on Day 1). The loss would be smaller with each passing day due to time decay.
Summary
Again, I am not suggesting you make this trade on TGT. The purpose here was simply to highlight a trade that has the potential to earn10% in roughly a week
BUT
Also to point out the risks that MUST be accounted for and managed.
Jay Kaeppel
Disclaimer: The data presented herein were obtained from various third-party sources. While I believe the data to be reliable, no representation is made as to, and no responsibility, warranty or liability is accepted for the accuracy or completeness of such information. The information, opinions and ideas expressed herein are for informational and educational purposes only and do not constitute and should not be construed as investment advice, an advertisement or offering of investment advisory services,


