Let’s be blunt; fear and greed suck. No matter how long you have been in the markets the “pull” of these two emotions is ever present. Basically, instead of having an angel on one shoulder and a devil on the other, it’s more like having a different devil on each shoulder.
One devil whispers things like “buy the bottom”, “increase your position size”, “this one could be a big winner”. The other whispers things like, “this looks like the top”, “the market WILL crash”, and the quintessential ‘sell NOW” (as the market bottoms out).
The fiends.
The truth is that although I have been in this business awhile (basically since what I refer to as “The Hair Era” in my life) and am a huge proponent of systematic trading, I still fight these “demons” all the time. To wit, I keep wanting to get bullish on gold, silver, gold stocks, silver stocks, and commodities in general (and I do think ultimately that will pay off). But the metals/commodities world has been sort of like a front-loading washer- up, down, roll over, fall down, climb back up, wash, rinse repeat.
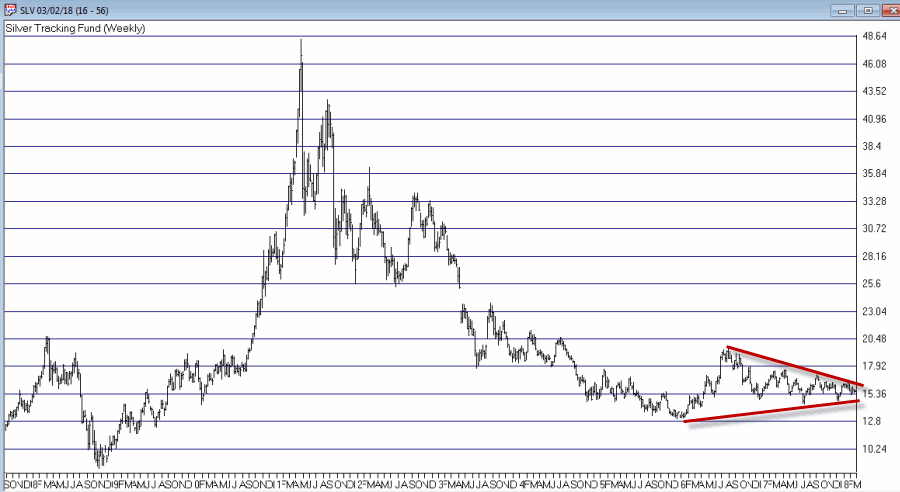
And still I have it in my mind that they are “setting up for a big move” (I think that comes from the devil on the left shoulder). When I look at the ever narrowing range I see for ticker SLV in Figure 1 I think it’s got to break out soon and when it does….” Figure 1 – Ticker SLV in narrowing range (Courtesy AIQ TradingExpert)
So imagine my delight when I saw the chart displayed in Figure 2 from www.KimbleChartingSolutions.com displayed in Figure 2 on the McVerryReport.
 Figure 2 – Silver – forming a “mega” cup & handle pattern? (Courtesy www.KimbleChartingSolutions.com)
William O’Neil, founder of Investor’s Business Daily popularized the “cup and handle” formation in his classic book “How to Make Money in Stocks.” Well, if the formation depicted in Figure 2 really is the “Mother of All Cup and Handle Formations’, then something spectacular lies ahead for silver. But still I had certain reservations. So I asked some professionals what they thought and got varying responses.
This reminded me once again, that a lot of things – chart formations especially – are in the eye of the beholder.
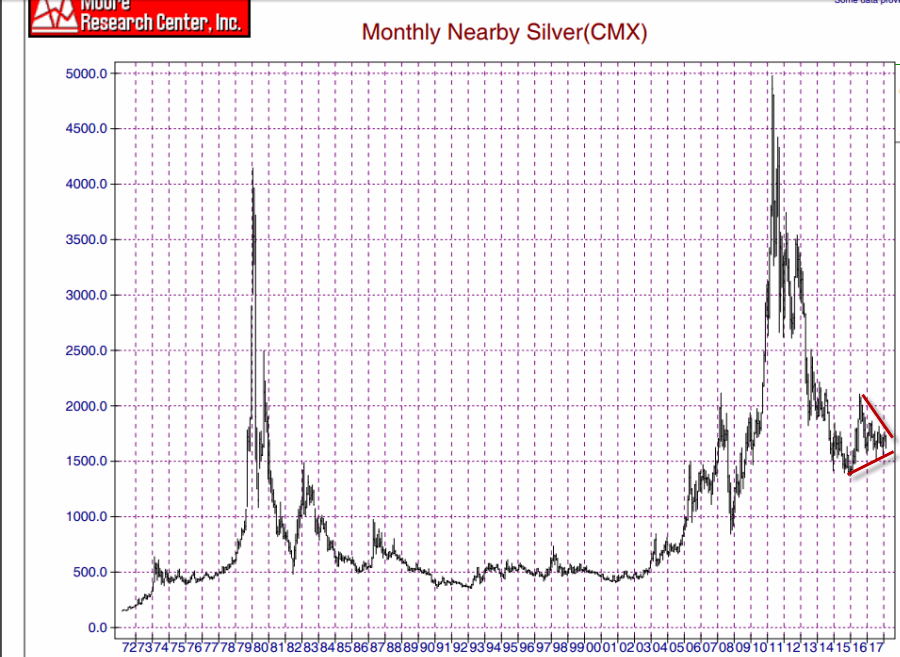
One response that sort of opened my eyes was from famed trader and Market Wizard Linda Racshke. One of the charts she posted appears in Figure 3.
 Figure 3 – Long-Term Silver;1972-2018 (Courtesy: Moore Research Center, Inc.)
When I look at Figure 3 – i.e., the “Big Picture” with no ones interpretation added things look a little different. When I look at the recent consolidation at the far right of Figure 3, I suddenly don’t see any reason why silver is “destined” to explode to the upside anytime soon. A perusal of Figure 3 reveals that there were plenty of times when silver “consolidated” into a tight range – and then drifted sideways to lower for literally years at a time.
So What Now?
I see two possible courses of action:
1. Put a small amount of capital into long-term call options on GLD, SLV, GDX, etc., and settle in.
2. Wait for an actual confirmation of an uptrend in metals before taking the plunge.
The Bad News is that “actual confirmation of an uptrend” is a lot like “a consolidation setting up for a big move”, in that there is more than one way to make this designation so again it’s all in “the eye of the beholder.”
That caveat in place, one possibility for someone opting for Choice #2 above appears in Figure 4. Gold futures have a resistance level somewhere in the range of $1,380 an ounce.
 Figure 4 – Gold futures with key “line in the sand” resistance near $1,380 (Courtesy ProfitSource by HUBB)
A breakout above $1,380 could signal that it’s time to move into metals. As long as gold remains below that level it seems pretty ambitious to call the trend in metals “bullish.”
Some lessons we (re)learn the hard way I guess.
Now if I could just get these guys on my shoulders to shut up…..
Jay Kaeppel
Disclaimer: The data presented herein were obtained from various third-party sources. While I believe the data to be reliable, no representation is made as to, and no responsibility, warranty or liability is accepted for the accuracy or completeness of such information. The information, opinions and ideas expressed herein are for informational and educational purposes only and do not constitute and should not be construed as investment advice, an advertisement or offering of investment advisory services, or an offer to sell or a solicitation to buy any security.


It Was tempting to buy the miners yesterday, I too am fighting the pull. Most bullish months for gold are over now.
Think I will stick to your end of month miners findings.
As usual, Jay…..a breath of fresh air in the financial blogosphere. Thanks for the good read.
The “distortion” between Linda’s and the Kimble chart simply seems to be founded in the scaling … I never understood why so many financial pros look at linear-based charts while they sail against winds from exponential powers and compounding numbers … not sure where this comes from, just an idea: for future traders, trades are absolut (refering to the buy price point and measured by points, i.e. 5 points in SI are same from 10 to 15 as from 45 to 50), while markets are relative (refering to “themselves”, measured in percent, i.e. the market value from 10 to 15 increased by 50% and only 10+% to 50) …
Anyway, thanks for your blog, fantastic content !!! Greetings from Europe!